[Webinar] Von Notfallmaßnahmen zu Null-Verlust-Resilienz | Jetzt registrieren
Apache Kafka® Console: Explore Kafka CLI Tools and Cloud UI
When developers or operators mention the Kafka console, they might be talking about two different tools. On one side, there are the command-line interface (CLI) tools, such as kafka-console-producer and kafka-console-consumer, which allow you to interact directly with Apache Kafka® from your terminal. On the other side, there is the Confluent Cloud Console, a web UI that simplifies cluster management and monitoring.
TL;DR: Use CLI tools for fast, local testing and scripts; use the Confluent Cloud Console for team visibility, governance, and production monitoring—try both with our quick starts.
What Is the Kafka Console? (CLI vs Cloud UI)
Both CLI tools and Confluent Cloud Console give you the ability to create topics, publish and consume messages, and oversee Kafka environments, but the experience is very different depending on which console you use.
The term “Kafka console” simply refers to the tools you use to communicate with Kafka. The CLI version has been around since the earliest days of Kafka. It gives developers and operators a way to quickly test, debug, and move messages through a cluster. Confluent Cloud Console, on the other hand, provides a more modern option. It offers a graphical dashboard where you can see your clusters, check their health, configure topics, and run quick tests without opening a terminal.
It’s used to interact with Kafka clusters, whether you’re producing messages, consuming data, monitoring system performance, or managing configurations. In short: the CLI is minimal and hands-on, while the Cloud Console is visual, collaborative, and production-friendly. To better understand the differences, let’s walk through how each one works.
Kafka CLI Console Tools
If you’ve ever worked with Kafka, you’ve probably used the command-line tools that come with it. They’re small, fast, and perfect for getting your hands dirty. With just a couple of commands, you can send messages to a Kafka topic and watch them flow through in real time.
The CLI tools are mainly two:
-
kafka-console-producer: For sending data into Kafka
-
kafka-console-consumer: For reading data back out
They’re simple, but they’re also how most developers first “feel” Kafka working.
Just getting started yourself? Take Kafka 101, free on Confluent Developer.
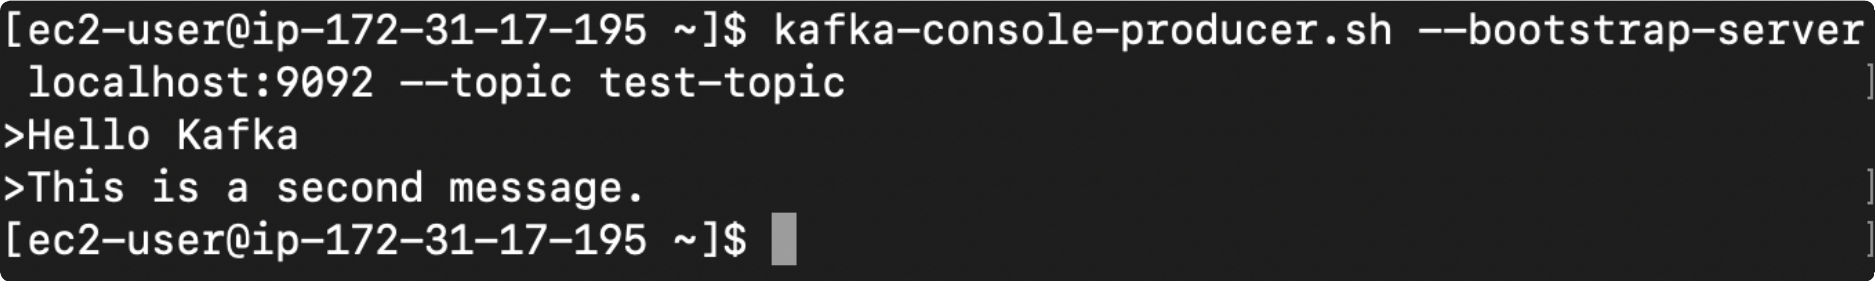
Kafka Console Producer
The kafka-console-producer is how you write messages into Kafka. Think of it like opening a text box directly connected to your Kafka topic. Every line you type becomes a message.
Here’s what it looks like in action:
kafka-console-producer \
  --broker-list localhost:9092 \
  --topic test-topic

Once you run this, Kafka connects to your local broker. Whatever you type next "Hello Kafka, This is a second message", anything immediately gets published to that topic.
It’s the simplest possible way to check that your Kafka setup is working. You can even pipe files into it if you want to send a bunch of messages at once:
cat sample_data.txt | kafka-console-producer --broker-list localhost:9092 --topic test-topic
That’s all it takes to generate test data and see your cluster in motion. If you’d like to go deeper, you can explore more examples in the self-guided Kafka tutorials available on Confluent Developer.
Kafka Console Consumer
Once messages are flowing, you’ll want to read them. That’s where kafka-console-consumer comes in.
It’s basically the mirror image of the producer you connect it to the same topic, and it displays every message that comes through.
How do I use kafka-console-consumer?
You can start consuming messages by running the following command:
kafka-console-consumer \
  --bootstrap-server localhost:9092 \
  --topic test-topic \
  --from-beginning
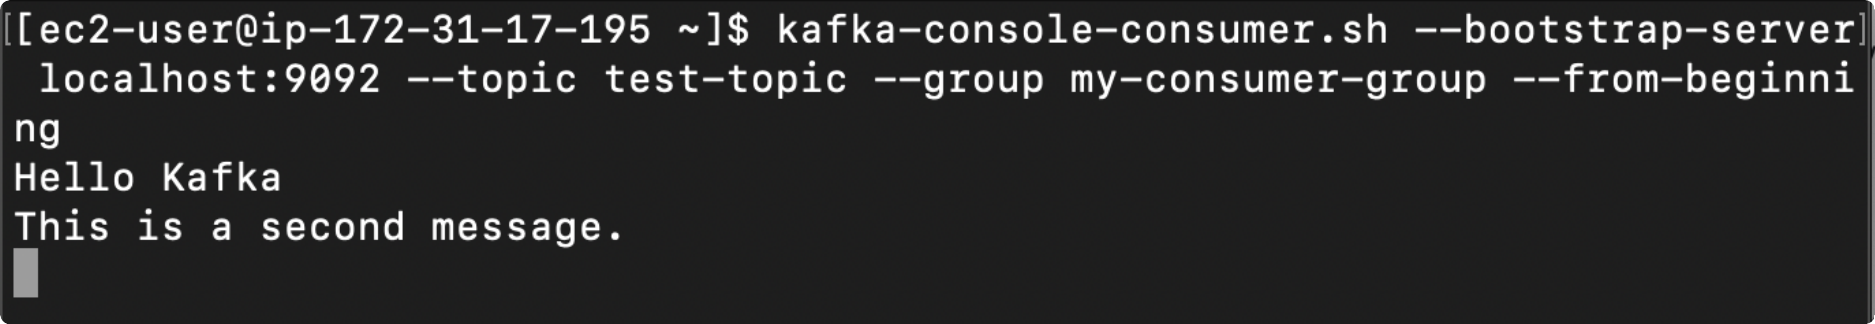
This connects to your Kafka broker and begins reading messages from the topic test-topic.
Without the --from-beginning flag, the consumer only shows new messages that arrive after you start it. Add that flag, and it’ll replay everything that’s ever been sent to the topic.
A few quick tips from real-world use:
-
Seeing nothing? Double-check your topic name and broker address. Typos are the #1 culprit.
-
Old messages missing? You probably forgot the --from-beginning flag.
-
Getting weird errors? Make sure the messages are plain text. This tool doesn’t handle JSON or Avro decoding by itself.
It’s simple, yes but once you understand the producer and consumer together, you’ve basically unlocked the core of Kafka.
Example CLI Workflow
The best way to see it in action is with a quick two-terminal demo:
- Open two terminals.
-
In the first one, start a producer:
kafka-console-producer --broker-list localhost:9092 --topic demo-topic -
In the second one, start a consumer:
kafka-console-consumer --bootstrap-server localhost:9092 --topic demo-topic --from-beginning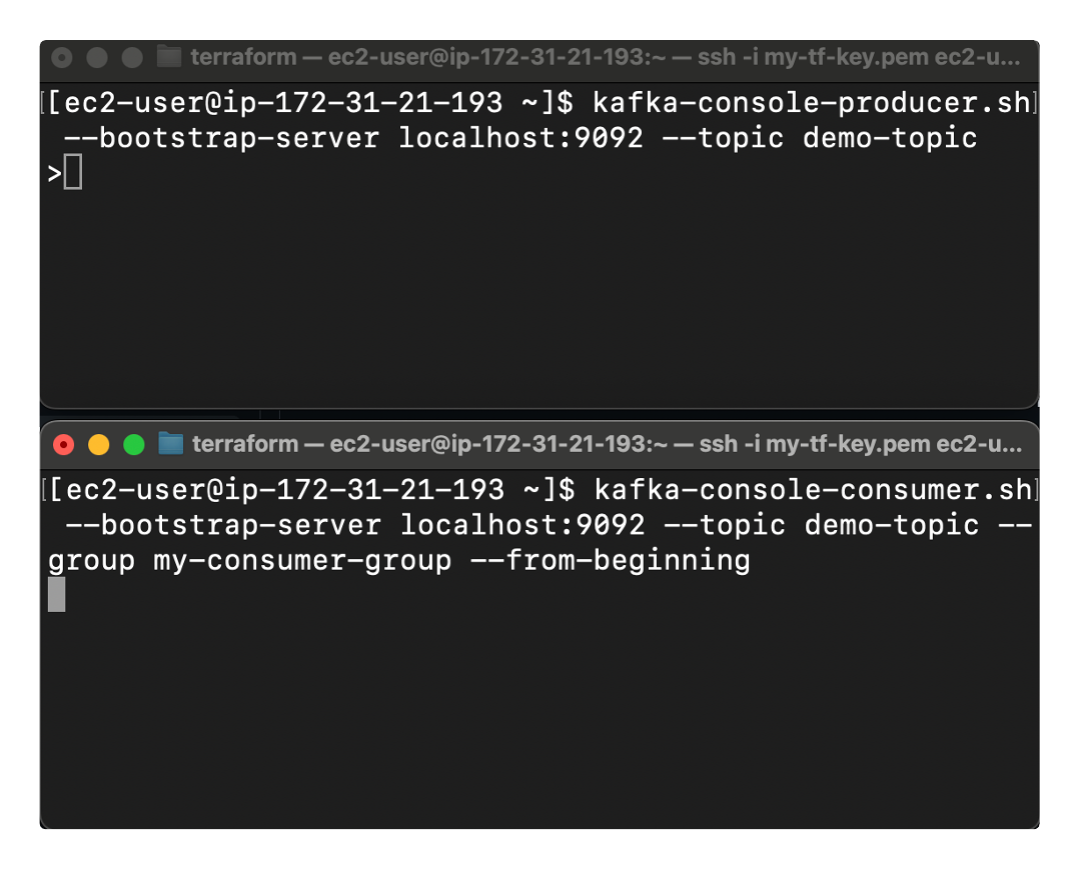
Kafka CLI workflow in action shown with a simple two-terminal demo -
Now type messages in the producer window. You’ll see them instantly appear in the consumer window.
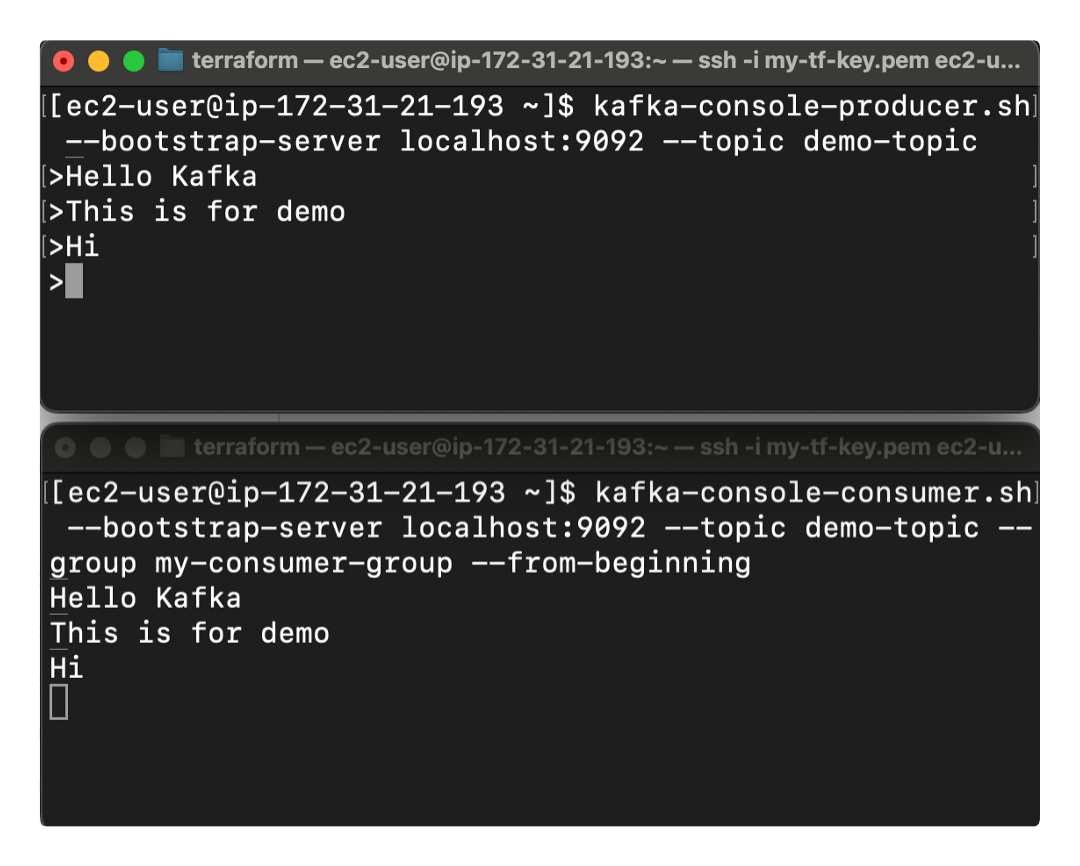
And just like that you’ve built a working Kafka pipeline. Messages flow from your producer → into the Kafka broker → out to your consumer, all in real time.
This little workflow is perfect for testing, debugging, or just getting a feel for how Kafka moves data. You’ll see immediately how topics act as the “middle ground” between systems that produce events and systems that react to them.
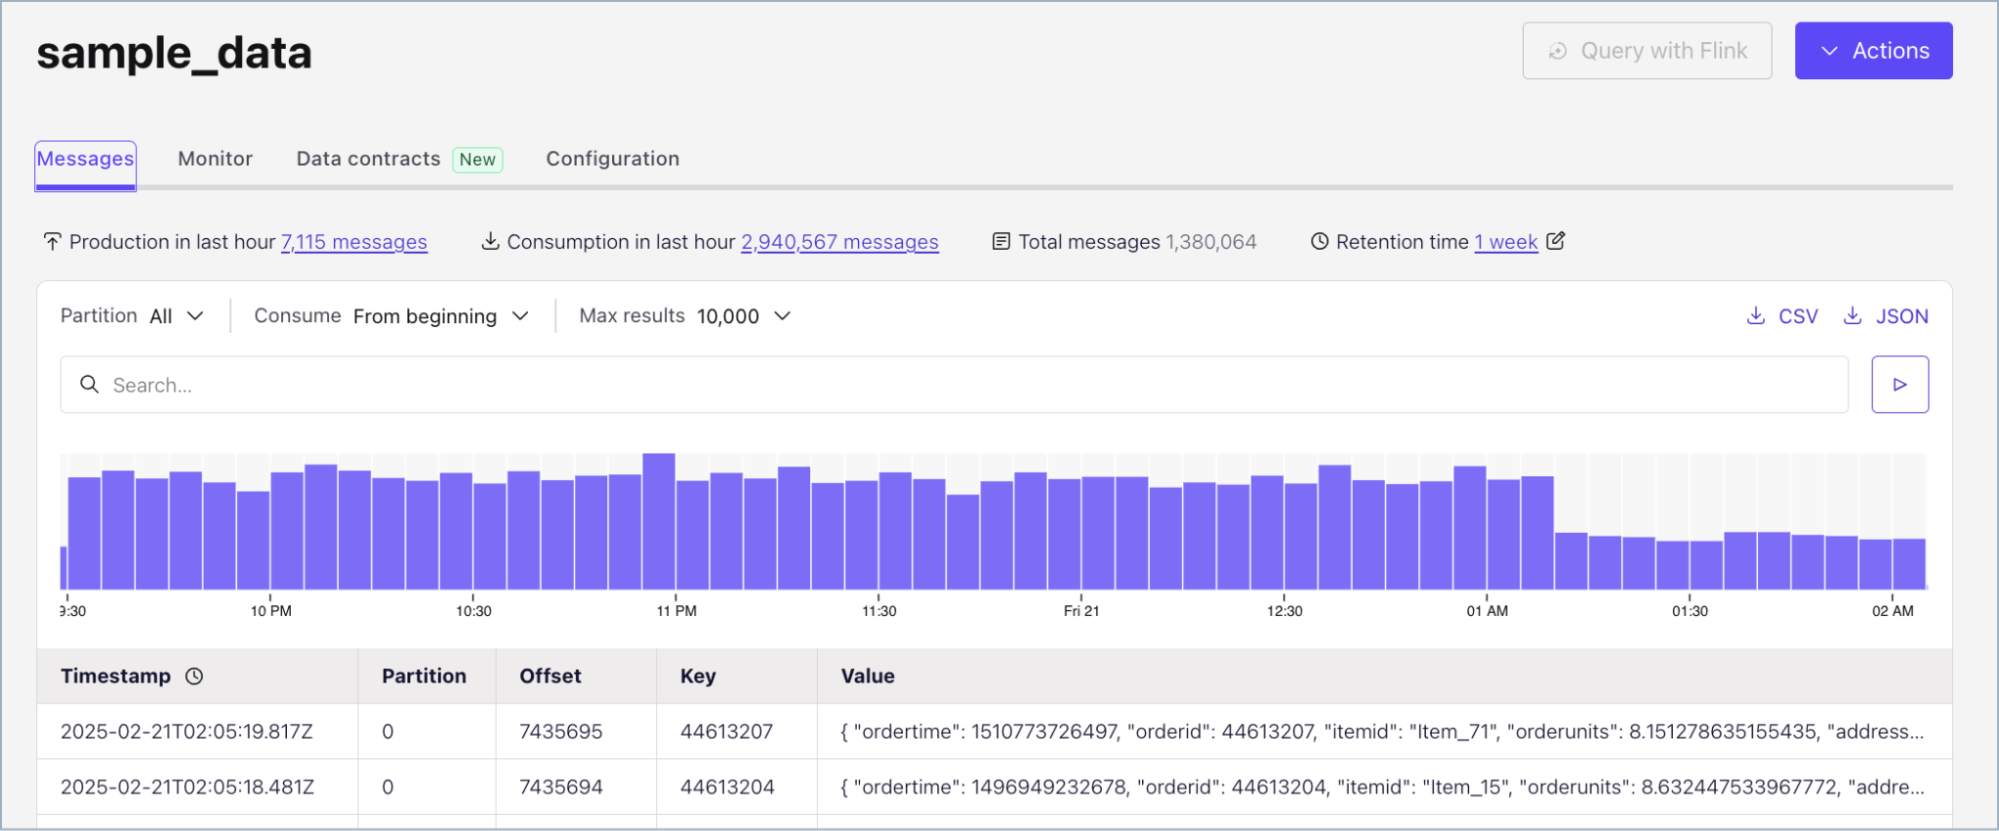
Confluent Cloud Console: Kafka UI in the Cloud
While Kafka’s command-line tools are fast and flexible, they can also feel intimidating, especially for less experienced developers or teams that need a shared view of what’s happening in production. That’s where the Confluent Cloud Console comes in, letting you manage, monitor, and interact with Kafka through a clean, visual interface instead of the terminal.
Once you log in, you’ll see all your Kafka clusters, topics, connectors, and schema registries organized in one place.
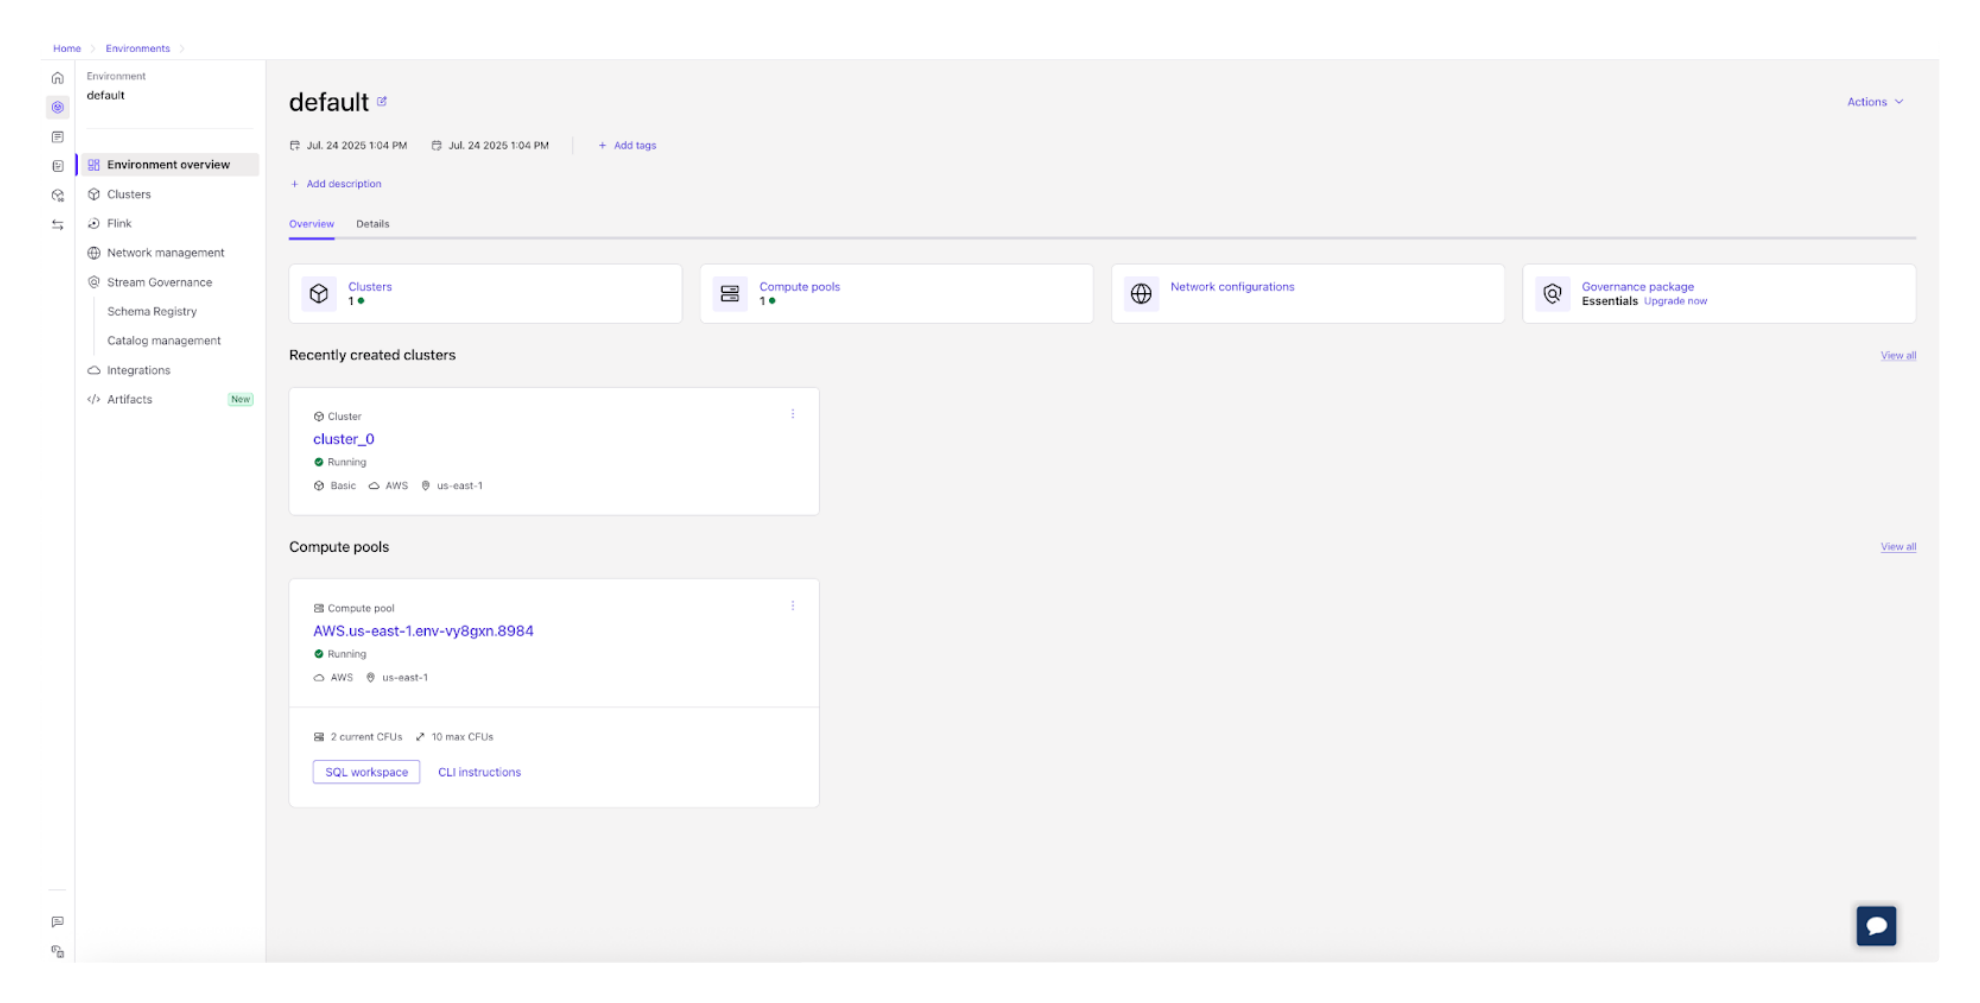
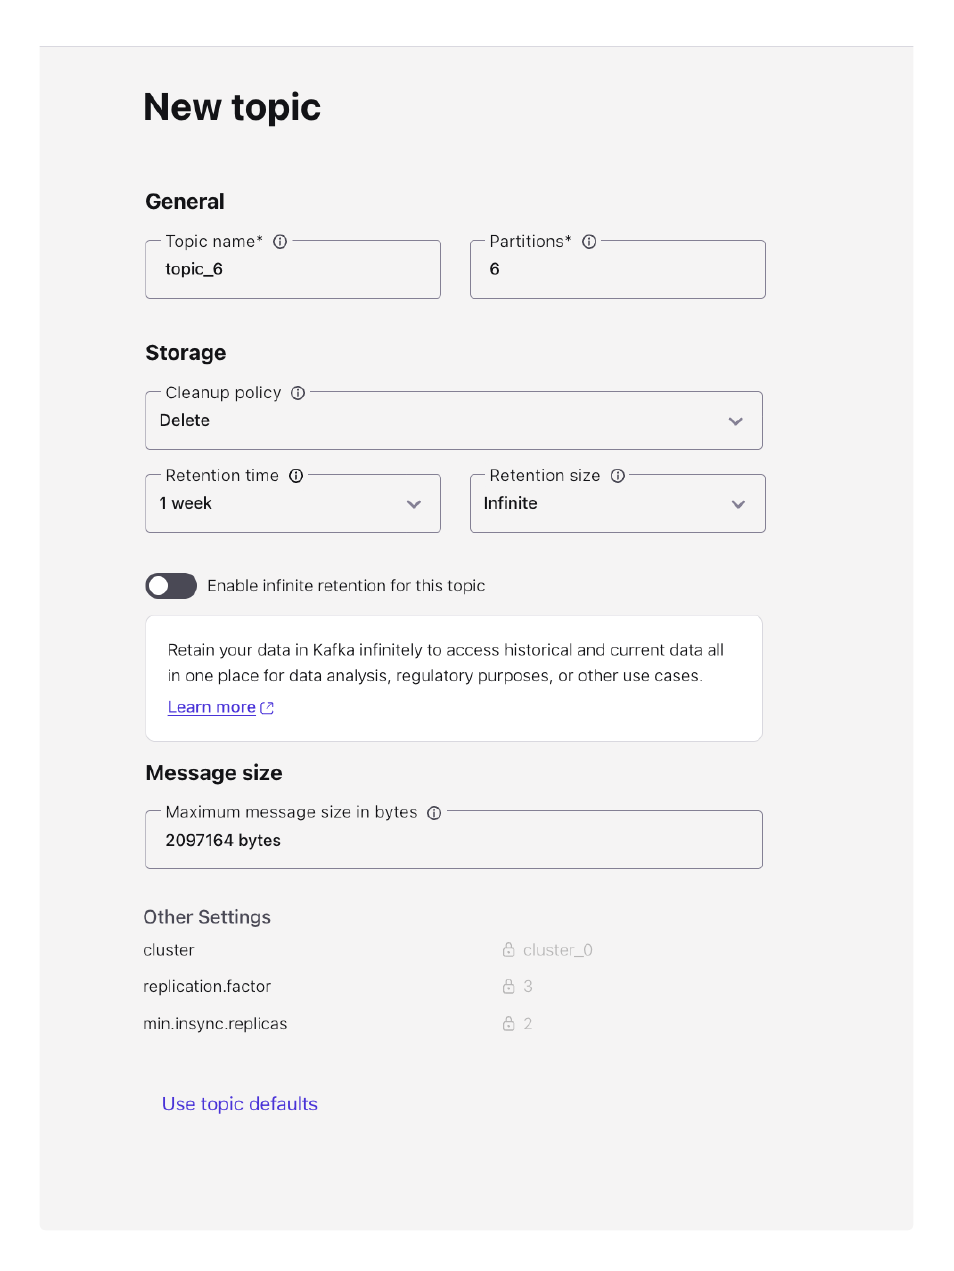
You can create and configure Kafka topics with a few clicks, adjust partitions or retention settings, and even produce or consume sample messages right from your browser.
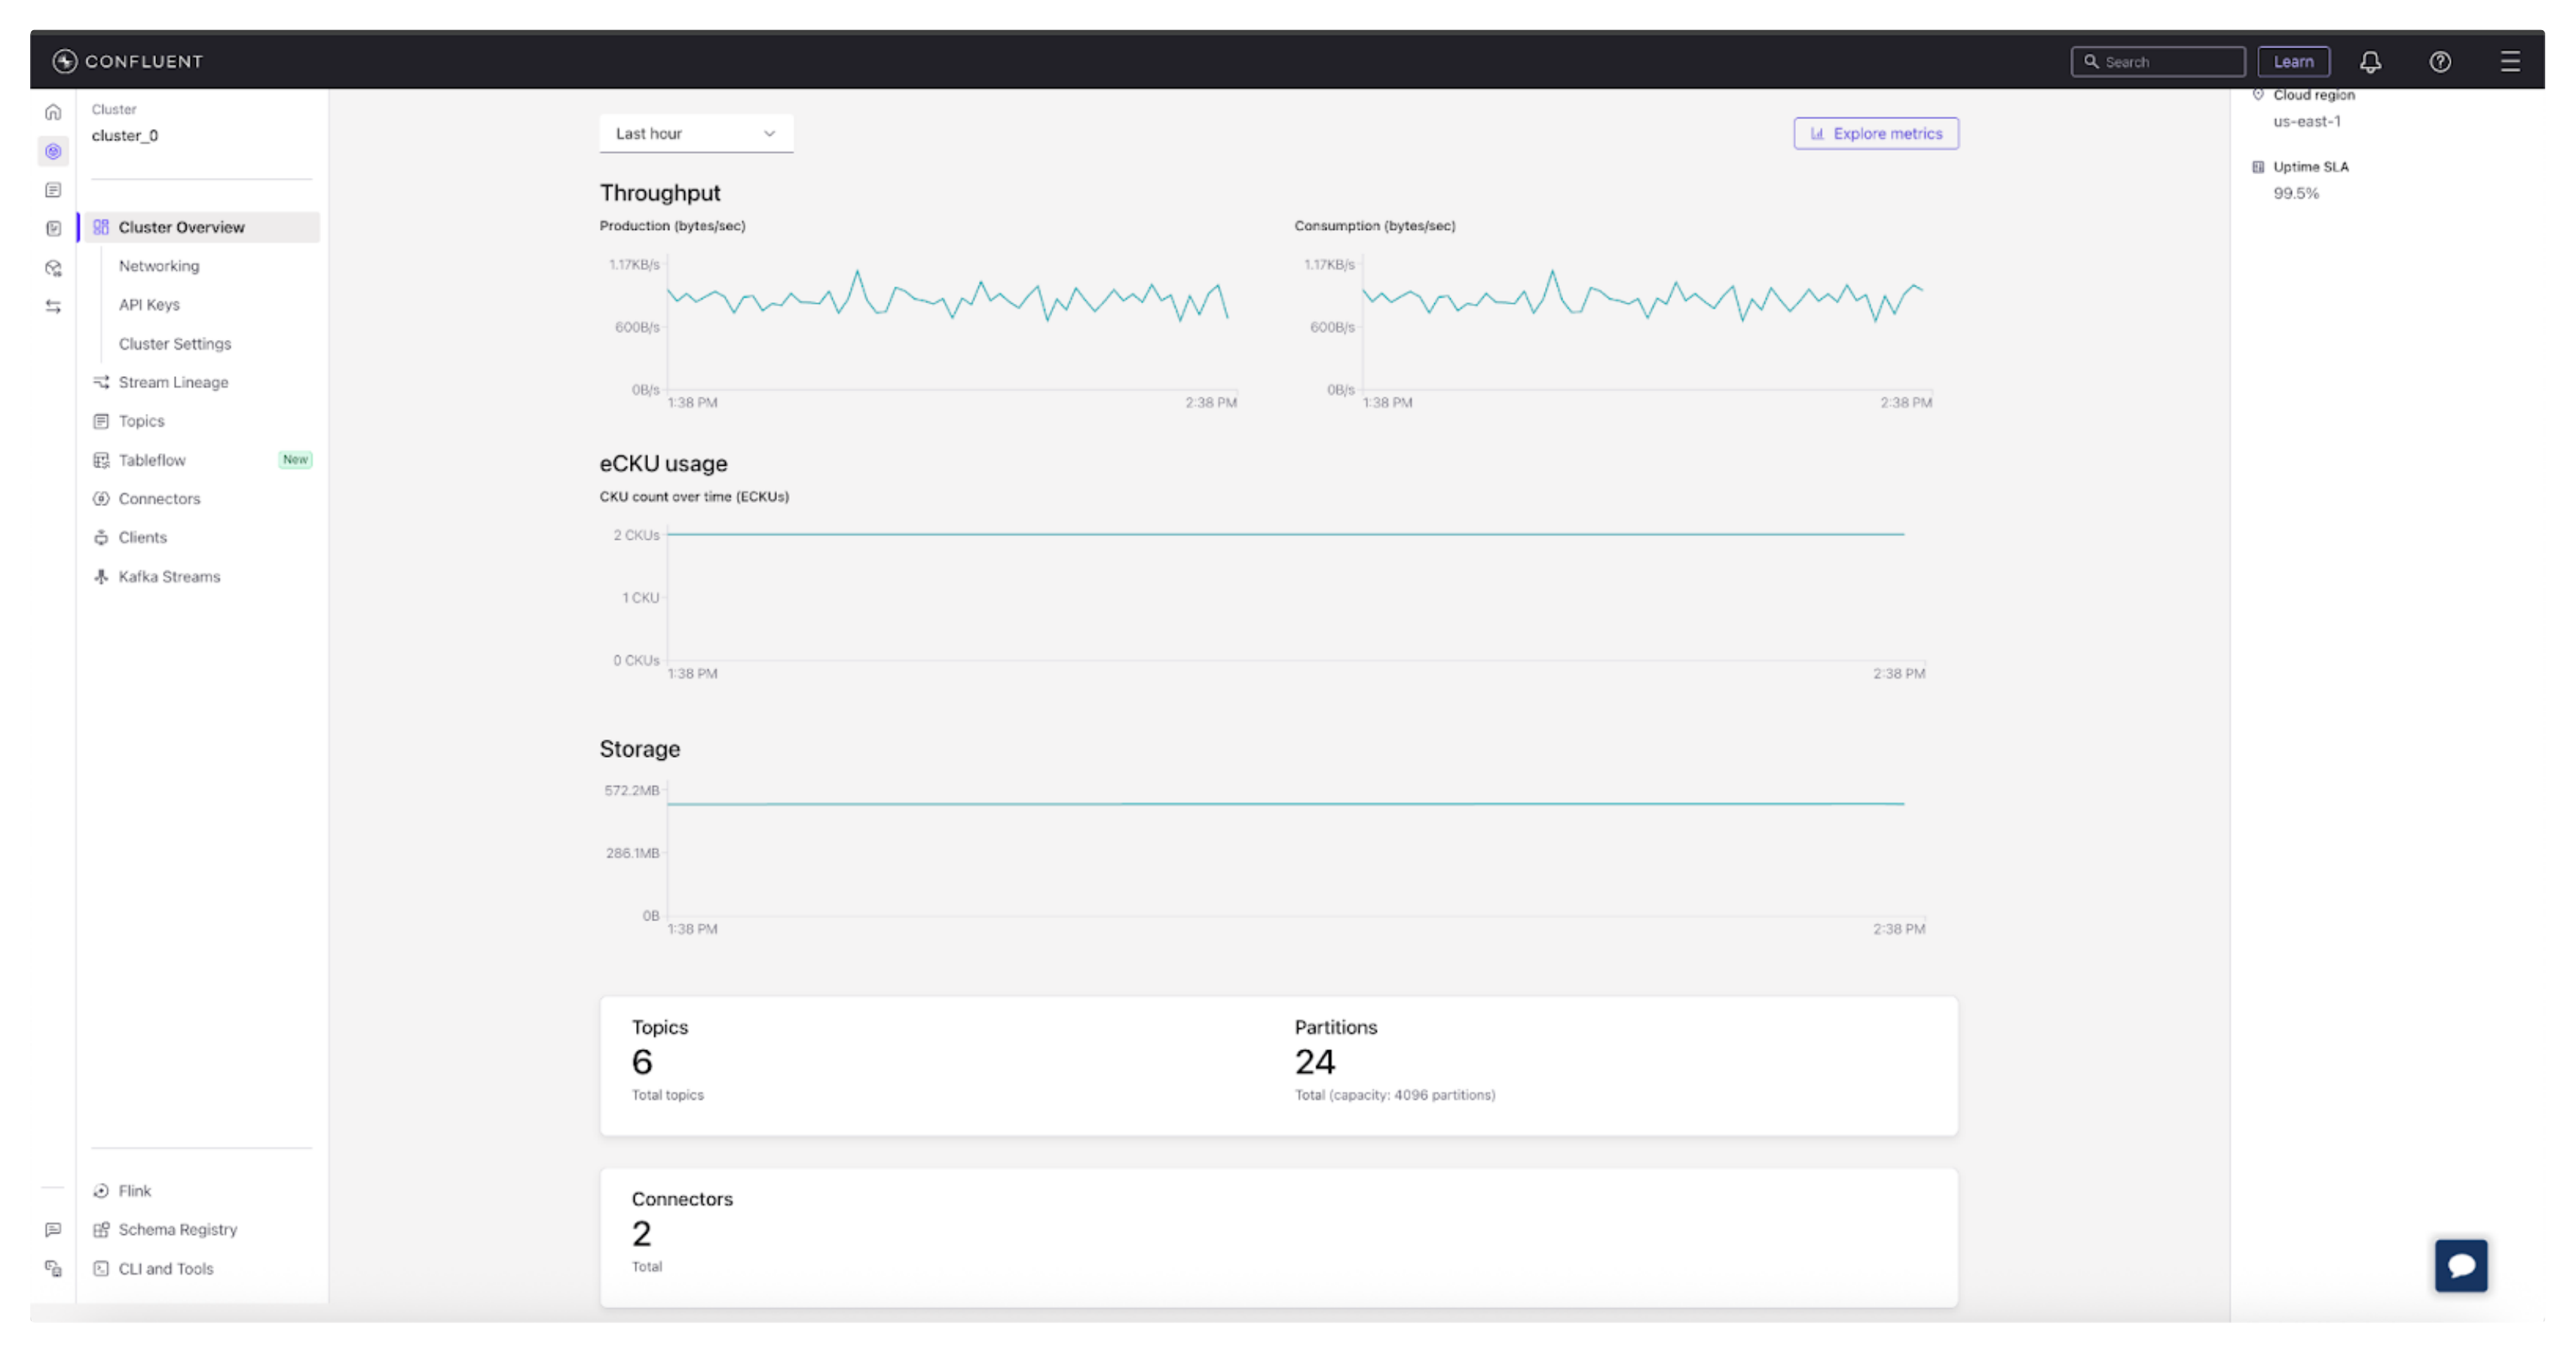
Built-in dashboards display metrics like throughput, consumer lag, and message rates in real time, giving you an instant sense of cluster health. There’s no need to run commands or parse logs; everything you need is available through charts, tables, and clear visual cues.
Kafka Console Use Cases and Benefits
Whether you use the Kafka CLI tools or the Confluent Cloud Console really comes down to what you’re trying to do and who you are. Both give you access to the same Kafka foundation, but they serve very different working styles.
The CLI is built for speed, control, and experimentation, while the Cloud Console focuses on visibility, collaboration, and governance. On the other hand, Cloud Console really shines when it comes to collaboration and visibility.
A CLI session is personal—it lives in your terminal, on your machine. Cloud Console, on the other hand, is ideal for teams. Access control is built right in: you can define roles, manage permissions, and enforce security policies without digging through config files. Encryption settings, audit logs, and API keys are all managed from one place, which makes governance and compliance far simpler than with local tools and makes it easier to coordinate, debug, and share responsibility for production systems.
-
For developers, the CLI is often the go-to tool. It’s fast, lightweight, and gives you a direct connection to Kafka without any layers in between, which can speed up testing and setup.
You can spin up a producer and consumer in seconds, send test messages, and instantly see them flow through your topic perfect for debugging or prototyping a new feature. The immediacy is what makes it powerful: type, send, see results. It’s the quickest way to confirm your logic, validate configurations, or just make sure your cluster is alive before you deploy anything serious.
-
For operators, the Cloud Console is where Kafka really opens up. It’s built for monitoring, governance, and control at scale. Instead of juggling command outputs or scanning logs, you get a live dashboard that tells you how your clusters are performing throughput, consumer lag, partitions, and topic growth all in one view. In essence, a monitoring hub that surfaces key metrics and alerts so issues can be caught before they escalate.
You can also manage access policies, encryption, and API keys right in the UI, making compliance and security far simpler. When you’re responsible for keeping Kafka healthy and secure in production, that kind of visibility is invaluable.
-
For teams, the Cloud Console turns Kafka into a shared workspace where everyone can see how data is flowing through the system. Developers can publish and test events, operators can monitor traffic, and managers can view system health all without needing to SSH into a server or copy commands.
Everyone works from the same data, the same metrics, and the same source of truth. That shared visibility reduces friction, speeds up debugging, and creates a stronger sense of ownership across departments—all without having to run a single command.
So When Should You Use CLI vs. Cloud Console?
-
Use the CLI when you want to test, debug, or prototype quickly in a local or development environment.
-
Use the Cloud Console when you need to manage Kafka clusters, monitor performance, or coordinate across teams in production.
-
Use both together the CLI for local testing and the Cloud Console for production monitoring to get the best of both worlds.
These differences reflect how modern organizations are moving toward more connected systems, known as an event-driven architecture. In an event-driven world, data flows in real time between applications, and the tools you use to manage that flow must fit your workflow. The Kafka CLI and Confluent Cloud Console are two sides of that same story: one gives you low-level control; the other gives you high-level oversight.
Here’s a quick comparison of which tool fits which role best:
|
Role |
Best Option |
Why It Fits |
|
Developers |
CLI Tools |
Fast setup for debugging, testing, and building prototypes locally. |
|
Operators |
Cloud Console |
Centralized monitoring, governance, and role-based access controls for production environments. |
|
Teams |
Cloud Console |
Shared visibility and collaboration across development, ops, and management. |
Kafka Console Best Practices and Troubleshooting
Working with the Kafka console whether through the command line or the Confluent Cloud UI is pretty straightforward once you get the hang of it. Still, a few best practices can make your experience smoother and save you time when something goes wrong. Most problems come from small oversights, missing flags, or configuration slips. Let’s look at what to watch out for.
Common Errors and Fixes
Most issues appear when using the Kafka CLI tools, especially for new users. Here are the most common ones:
-
Typos in topic names or broker addresses: Kafka topic names are case-sensitive. For example, Test-Topic and test-topic are not the same. Always double-check spelling and capitalization.
-
Missing the --from-beginning flag: Without this flag, the consumer only shows new messages that arrive after it starts. Add --from-beginning if you want to see all existing messages in the topic.
-
Forgetting --group: When testing consumer groups, you must specify a group ID (e.g., --group my-test-group). If multiple consumers use the same group ID, they will split the partitions (load balance). If you want all consumers to get all messages (broadcast), each must have a unique group ID (or default to a random one).
-
Not seeing message keys: By default, the console consumer only prints the message value. If your messages have keys (e.g., for partitioning), add --property print.key=true (and often --property key.separator=":") to display them.
-
Incorrect port or inactive broker: Make sure your Kafka service is actually running and reachable. A wrong port number or stopped broker is a common cause of “no data.”
-
Unsupported message formats: The console tools display plain text only. They don’t automatically handle JSON or Avro decoding. Use serializers or the Schema Registry for that.
-
Assuming Kafka is broken: Review your command carefully before diving into deeper debugging. Many times you’ll find that Kafka deployment is operating as expected—it's just a small syntax or config error.
Security Considerations
Kafka often carries sensitive data transactions, logs, and event streams so securing your setup should never be optional.
Here’s how to keep it safe:
-
Enable Transport Layer Security (TLS): Encrypts data flowing between producers, brokers, and consumers. Without it, your data travels as plain text.
-
Use authentication: Set up SASL or API keys to make sure only authorized users and applications can publish or consume data.
-
Apply authentication in the CLI: When connecting to a secure cluster from the command line, you must pass credentials. This is often done by specifying a properties file (e.g., --consumer.config client.properties) that contains your API keys (SASL) or truststore/keystore locations (mTLS).
-
Grant access by role: Follow the principle of least privilege. Developers might have full access in test environments but only read access in production.
-
Rotate credentials regularly: Refresh API keys or tokens to prevent unauthorized access.
In Confluent Cloud, encryption and authentication are handled automatically. You can manage roles, permissions, and audit logs right from Cloud Console, no extra setup needed.
That’s part of the reason why most teams use both the CLI for fast local testing and the Cloud Console for production operations. In practice, a good workflow often combines both: use the CLI for quick tests and troubleshooting, then manage and secure your production clusters through the Cloud Console. That way, you get the best of both worlds flexibility during development, and governance when it matters most.
Choose the CLI when:
-
You’re working locally or debugging issues.
-
You need quick, hands-on control.
-
You want to script or automate simple workflows.
Choose an enterprise-grade UI like Cloud Console when:
-
You’re managing shared or production environments.
-
You need dashboards for monitoring and usage tracking.
-
You want built-in security, governance, and collaboration tools.
CLI vs. Cloud: Quick Kafka Console Comparison
|
Feature |
CLI Quick Start |
Cloud Quick Start |
|
Setup Time |
Requires local installation and broker startup |
Ready in minutes, fully managed |
|
Interface |
Command-line (terminal) |
Web-based dashboard |
|
Best For |
Local testing, debugging, and learning Kafka fundamentals |
Production use, collaboration, and monitoring |
|
Data Flow Demo |
Manual: producer → broker → consumer |
In-browser message production and consumption |
|
Security & Governance |
Manual TLS/SASL configuration |
Built-in encryption, roles, and audit logs |
|
Monitoring |
Requires CLI tools or custom scripts |
Real-time dashboards and metrics |
|
Scalability |
Limited to local setup |
Fully scalable with Confluent Cloud |
|
Ease of Use |
Technical setup required |
Beginner-friendly, no installation |
|
Ideal Users |
Developers and learners |
Teams and operators managing Kafka at scale |
To visualize it, think of a simple flow: produce → consume → secure. Start with data flowing freely in development, validate it using CLI tools, and then lock it down as you scale into production with the Cloud Console’s built-in policies and controls. Following that path keeps your Kafka setup not just functional, but safe, maintainable, and future-proof.
Try It Out: Kafka Console Quick Start
Now that you know the best practices, let’s see how you can actually try Kafka in action. Here’s a quick look at both options.
CLI Quick Start
If you prefer a hands-on setup, the Kafka CLI tools let you try Kafka locally.
Steps:
-
Install Kafka locally and start a broker.
-
Open one terminal and start a producer:
kafka-console-producer --broker-list localhost:9092 --topic demo-topic -
Open another terminal and start a consumer:
kafka-console-consumer --bootstrap-server localhost:9092 --topic demo-topic --from-beginning -
Type a few messages into the producer window and they'll appear instantly in the consumer window.
This is the simplest way to see messages flow through Kafka and understand how producers and consumers interact. Visit the Kafka Quick Start on Confluent Developer for more details.
Cloud Console Quick Start
If you’d rather skip installations, the Confluent Cloud Console gives you a ready-to-use Kafka environment in minutes.
Steps:
-
Sign up for Confluent Cloud (it’s free to start).
-
Create a Kafka cluster right from the dashboard.
-
Add a topic with one click.
-
Produce and consume messages directly in your browser.
-
View real-time metrics for throughput, partitions, and consumer lag.
This option gives you the full Kafka experience managed, secure, and scalable with no local setup required. This option gives you the full Kafka experience managed, secure, and scalable with no local setup required. Visit the Confluent Cloud Quick Start documentation for full details.
Both quick starts take only a few minutes, but serve different needs:
-
The CLI Quick Start helps you learn Kafka fundamentals hands-on.
-
The Cloud Quick Start gives you a production-ready experience with monitoring and governance built in.
Together, they give you a complete picture of Kafka from your local terminal all the way to the cloud.
Next steps: Want to try Kafka without managing servers? Sign up for free and start experimenting with the Confluent Cloud Console today.
Kafka Console FAQs
What is the Kafka console?
It can refer either to the Kafka CLI tools or the Confluent Cloud Console UI. Both let you interact with Kafka, but they serve different needs.
How do I use kafka-console-producer?
Run the command, connect to a broker, and type messages into your terminal. Each line you enter is published to the Kafka topic.
What’s the difference between Kafka CLI and Confluent Cloud Console?
The CLI is lightweight and best for developers working locally. The Cloud Console is a managed, visual UI that simplifies monitoring, governance, and team collaboration in production environments.