[Webinar] Von Notfallmaßnahmen zu Null-Verlust-Resilienz | Jetzt registrieren
Hands-Free Kafka Replication: A Lesson in Operational Simplicity
Building operational simplicity into distributed systems, especially for nuanced behaviors, is somewhat of an art and often best achieved after gathering production experience. Apache Kafka‘s popularity can be attributed in large part to its design and operational simplicity. As we add more knobs and features, we try to go back and rethink ways of simplifying complex behaviors.
One of the more nuanced features of Apache Kafka is its replication protocol. Tuning Kafka replication to work automatically, for varying size workloads on a single cluster, is somewhat tricky today. One of the challenges that make this particularly difficult is knowing how to prevent replicas from jumping in and out of the in-sync replica list (aka ISR). What this means from a user’s perspective is that if a producer sends a batch of messages “large enough”, then this can cause several alerts to go off on the Kafka brokers. These alerts indicate that some topics are “under replicated” which means that data is not being replicated to enough brokers, thereby increasing the probability of data loss should those replicas fail or die. So it is important that the “under replicated” partition count be monitored closely in a Kafka cluster. However, this alert should go off only when some broker fails, slows down, or pauses and not when the producer writes data of varying sizes. This unexpected behavior and the false alarms are the source of a lot of manual operational overhead and churn. In this post, I discuss the root cause of this behavior and how we arrived at the fix.
Key takeaway – for the best operational experience, express configs in terms of what the user knows, not in terms of what the user has to guess.
Kafka replication: 0 to 60 in 1 minute
Every partition in a Kafka topic has a write-ahead log where the messages are stored and every message has a unique offset that identifies its position in the partition’s log.
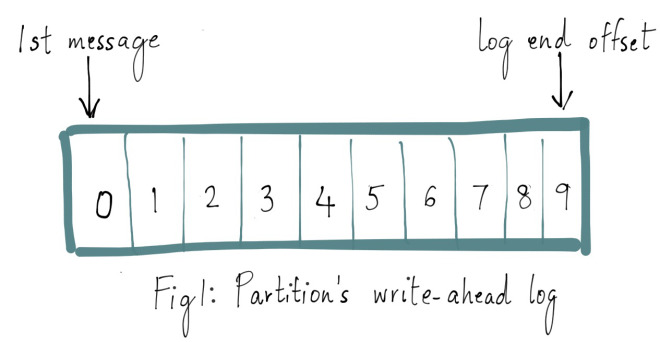
Every topic partition in Kafka is replicated n times, where n is the replication factor of the topic. This allows Kafka to automatically failover to these replicas when a server in the cluster fails so that messages remain available in the presence of failures. Replication in Kafka happens at the partition granularity where the partition’s write-ahead log is replicated in order to n servers. Out of the n replicas, one replica is designated as the leader while others are followers. As the name suggests, the leader takes the writes from the producer and the followers merely copy the leader’s log in order.
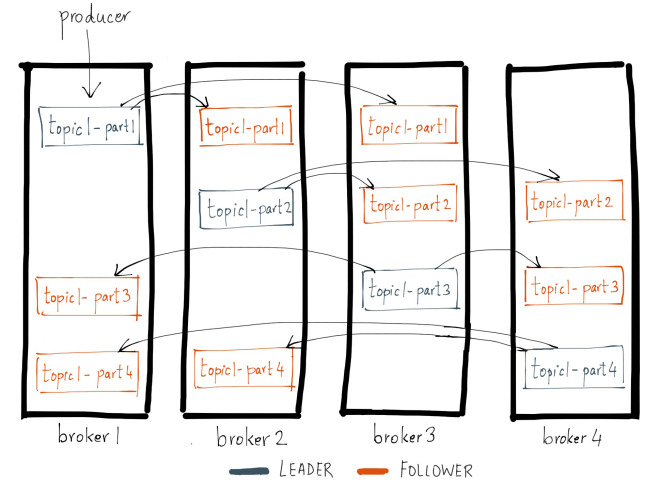
The fundamental guarantee a log replication algorithm must provide is that if it tells the client a message is committed, and the leader fails, the newly elected leader must also have that message. Kafka gives this guarantee by requiring the leader to be elected from a subset of replicas that are “in sync” with the previous leader or, in other words, caught up to the leader’s log. The leader for every partition tracks this in-sync replica (aka ISR) list by computing the lag of every replica from itself. When a producer sends a message to the broker, it is written by the leader and replicated to all the partition’s replicas. A message is committed only after it has been successfully copied to all the in-sync replicas. Since the message replication latency is capped by the slowest in-sync replica, it is important to quickly detect slow replicas and remove them from the in-sync replica list. The details of Kafka’s replication protocol are somewhat nuanced and this blog is not intended to be an exhaustive discussion of the topic. You can read more about how Kafka replication works here. For the sake of this discussion, we’ll focus on the operability of the replication protocol.
What does it mean for a replica to be caught up to the leader?
I referred to a replica that has not “caught up” to the leader’s log as possibly being marked as an out-of-sync replica. Let me explain what being caught up really means with the help of an example. Let’s take an example of a single partition topic foo with a replication factor of 3. Assume that the replicas for this partition live on brokers 1, 2, and 3 and that 3 messages have been committed on topic foo. Replica on broker 1 is the current leader and replicas 2 and 3 are followers and all replicas are part of the ISR. Also assume that replica.lag.max.messages is set to 4 which means that as long as a follower is behind the leader by not more than 3 messages, it will not be removed from the ISR. And replica.lag.time.max.ms is set to 500 ms which means that as long as the followers send a fetch request to the leader every 500 ms or sooner, they will not be marked dead and will not be removed from the ISR.
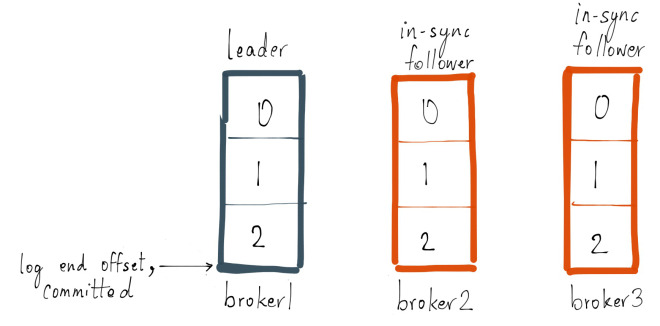
Now let’s say, the producer sends the next 1 message to the leader, and at the same time follower broker 3 goes into a GC pause, their logs would look like this:
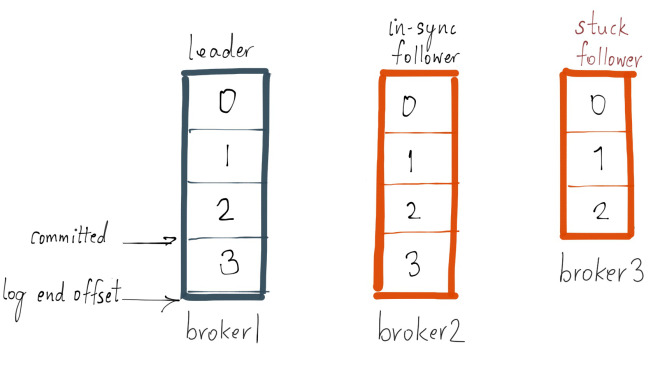
Since broker 3 is in the ISR, the latest message is not considered to be committed until either broker 3 is removed from the ISR or catches up to the leader’s log end offset. Note that since broker 3 is less than replica.lag.max.messages=4 messages behind the leader, it does not qualify to be removed from the ISR. In this case, it means follower broker 3 needs to catch up to offset 3 and if it did, then it has fully “caught up” to the leader’s log. Let’s assume that broker 3 comes out of its GC pause within 100ms and catches up to the leader’s log end offset. In this state, their logs would look like this:
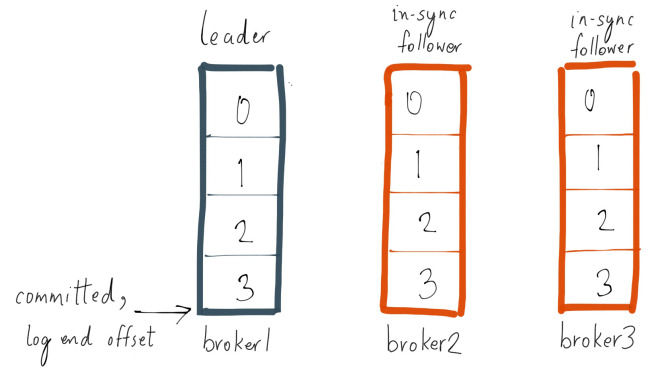
What causes a replica to be out of sync with the leader?
A replica can be out-of-sync with the leader for several reasons:
- Slow replica: A follower replica that is consistently not able to catch up with the writes on the leader for a certain period of time. One of the most common reasons for this is an I/O bottleneck on the follower replica causing it to append the copied messages at a rate slower than it can consume from the leader.
- Stuck replica: A follower replica that has stopped fetching from the leader for a certain period of time. A replica could be stuck either due to a GC pause or because it has failed or died.
- Bootstrapping replica: When the user increases the replication factor of the topic, the new follower replicas are out-of-sync until they are fully caught up to the leader’s log.
A replica is considered to be out-of-sync or lagging when it falls “sufficiently” behind the leader of the partition. In Kafka 0.8.2, the replica’s lag is measured either in terms of the number of messages it is behind the leader (replica.lag.max.messages) or the time for which the replica has not attempted to fetch new data from the leader (replica.lag.time.max.ms). The former is used to detect slow replicas while the latter is used to detect halted or dead replicas.
How do you determine that a replica is lagging?
This model of detecting out-of-sync stuck replicas works well in all cases. It tracks the time for which a follower replica has not sent a fetch request to the leader, indicating it is dead. On the other hand, the model of detecting out-of-sync slow replicas using the number of messages only works well if you set these parameters for a single topic or multiple topics with homogeneous traffic patterns, but we’ve found that it does not scale to the variety of workloads across all topics in a production cluster.
Building on top of my previous example, if topic foo gets data at the rate of 2 msg/sec where a single batch received on the leader normally never exceeds 3 messages, then you know that replica.lag.max.messages can be set to 4 for that topic. Why? Because after the largest batch is appended to the leader and before the follower replicas copy those messages, the follower’s logs will be behind the leader by no more than 3 messages. At the same time, if the follower replicas for topic foo start lagging behind the leader consistently by more than 3 messages, you want the leader to remove the slow follower replica and prevent the message write latency from increasing.
Which is essentially the goal of replica.lag.max.messages–being able to detect replicas that are consistently out-of-sync with the leader. However, now, let’s say, the traffic on the same topic increases organically or due to a spike and the producer ends up sending a batch of 4 messages, equal to the configured value for replica.lag.max.messages=4. At that instant, both follower replicas will be considered out-of-sync with the leader and will be pushed out of the ISR.
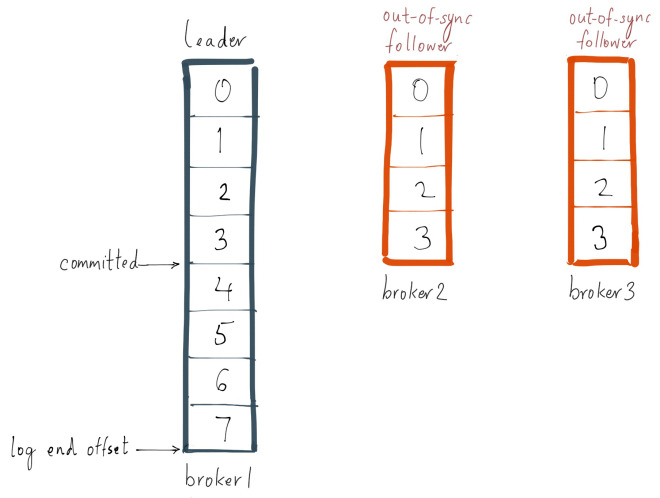
However, since both follower replicas are alive, they will catch up to the leader’s log end offset in the next fetch request and be added back to the ISR. The same process will repeat if the producer continues to send a relatively large batch of messages to the leader. This demonstrates the case when follower replicas shuttle in and out of the ISR unnecessarily triggering false alerts.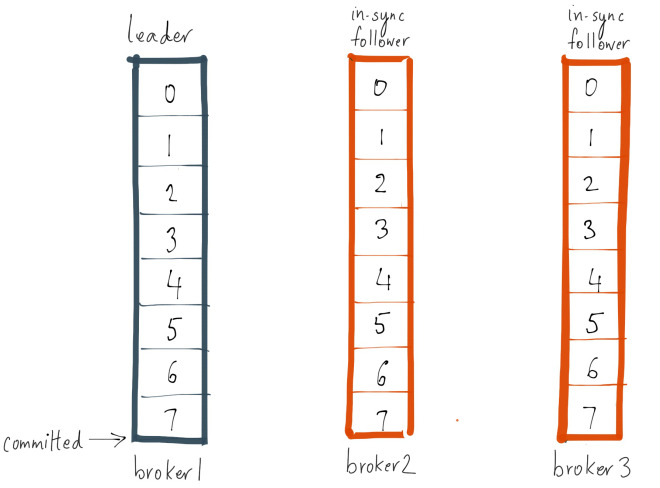
This points to the core problem with replica.lag.max.messages. It expresses the replication configs based on a value that the user has to guess and doesn’t know for sure at the time of configuration – the incoming traffic on Kafka topics!
One config to rule them all
What we realized is that there is only one thing that really matters in order to detect either a stuck or a slow replica and that’s the time for which a replica has been out-of-sync with the leader. Removing the lag definition in terms of number of messages gets rid of the need to guess the right value based on the expected traffic for the topic. Now there is only one value you need to configure on the server which is replica.lag.time.max.ms. The interpretation of this has changed to be the time for which a replica has been out-of-sync with the leader. Stuck or failed replicas are detected the same way as before–if a replica fails to send a fetch request for longer than replica.lag.time.max.ms, it is considered dead and is removed from the ISR. The mechanism of detecting slow replicas has changed–if a replica starts lagging behind the leader for longer than replica.lag.time.max.ms, then it is considered too slow and is removed from the ISR. So even if there is a spike in traffic and large batches of messages are written on the leader, unless the replica consistently remains behind the leader for replica.lag.time.max.ms, it will not shuffle in and out of the ISR.
This new model for detecting out-of-sync replicas puts an upper bound on the message commit latency and also removes the need for any guesswork.
How do I GET this?
This change will available in the next version of the Confluent Platform. We’d like to thank Aditya Auradkar for contributing this enhancement to Kafka. If you’d like to get involved and contribute to Kafka, sign up for the mailing list or check out some newbie JIRAs. If you like working on Kafka and are interested in working in the real-time streaming space, Confluent is hiring!
Ist dieser Blog-Beitrag interessant? Jetzt teilen
Confluent-Blog abonnieren
From Dumb Pipes to a Smart Data Plane: Introducing Schema IDs in Apache Kafka® Headers
Confluent’s Schema IDs in headers transform Kafka from "dumb pipes" to a "smart data plane." By moving metadata out of payloads, teams can schematize topics without breaking legacy apps or requiring big-bang migrations. This unlocks governed, AI-ready data for Flink and lakehouses with ease.
Queues for Apache Kafka® Is Here: Your Guide to Getting Started in Confluent
Confluent announces the General Availability of Queues for Kafka on Confluent Cloud and Confluent Platform with Apache Kafka 4.2. This production-ready feature brings native queue semantics to Kafka through KIP-932, enabling organizations to consolidate streaming and queuing infrastructure while...

