[Webinar] Von Notfallmaßnahmen zu Null-Verlust-Resilienz | Jetzt registrieren
Real-Time Fleet Management Using Confluent Cloud and MongoDB
Most organisations maintain fleets, a collection of vehicles put to use for day-to-day operations. Telcos use a variety of vehicles including cars, vans, and trucks for service, delivery, and maintenance. Mining companies use remote fleets that include gigantic trucks, cranes, and autonomous trains. Transportation and logistics companies utilize large fleets of trucks to service their customers. And rental companies, dealerships, finance companies, and insurance companies use fleet data to better understand and respond to their customer needs.
Fleets emit a variety of real-time events through their vehicle’s telemetry devices, and there are a lot of use cases built around the telemetry data, including:
- Increasing customer satisfaction: Efficiently route and deliver services on time, and improve driving quality
- Reducing carbon footprint: Increase fuel efficiency and optimise driving patterns
- Optimizing fleet maintenance: Monitor spare-part inventory and automate service schedule based on performance and usage
- Improving driver safety: Monitor driver behaviour and performance in real time
Fleet management is also inherently challenging because there is so much data involved. For example, a typical transportation company could easily operate thousands of trucks across the country that come from various manufacturers and have different capabilities. Building a single pane of glass to monitor such large fleets is a complex problem to solve.
This article showcases how to build a simple fleet management solution using Confluent Cloud, fully managed ksqlDB, Kafka Connect with MongoDB connectors, and the fully managed database as a service MongoDB Atlas.
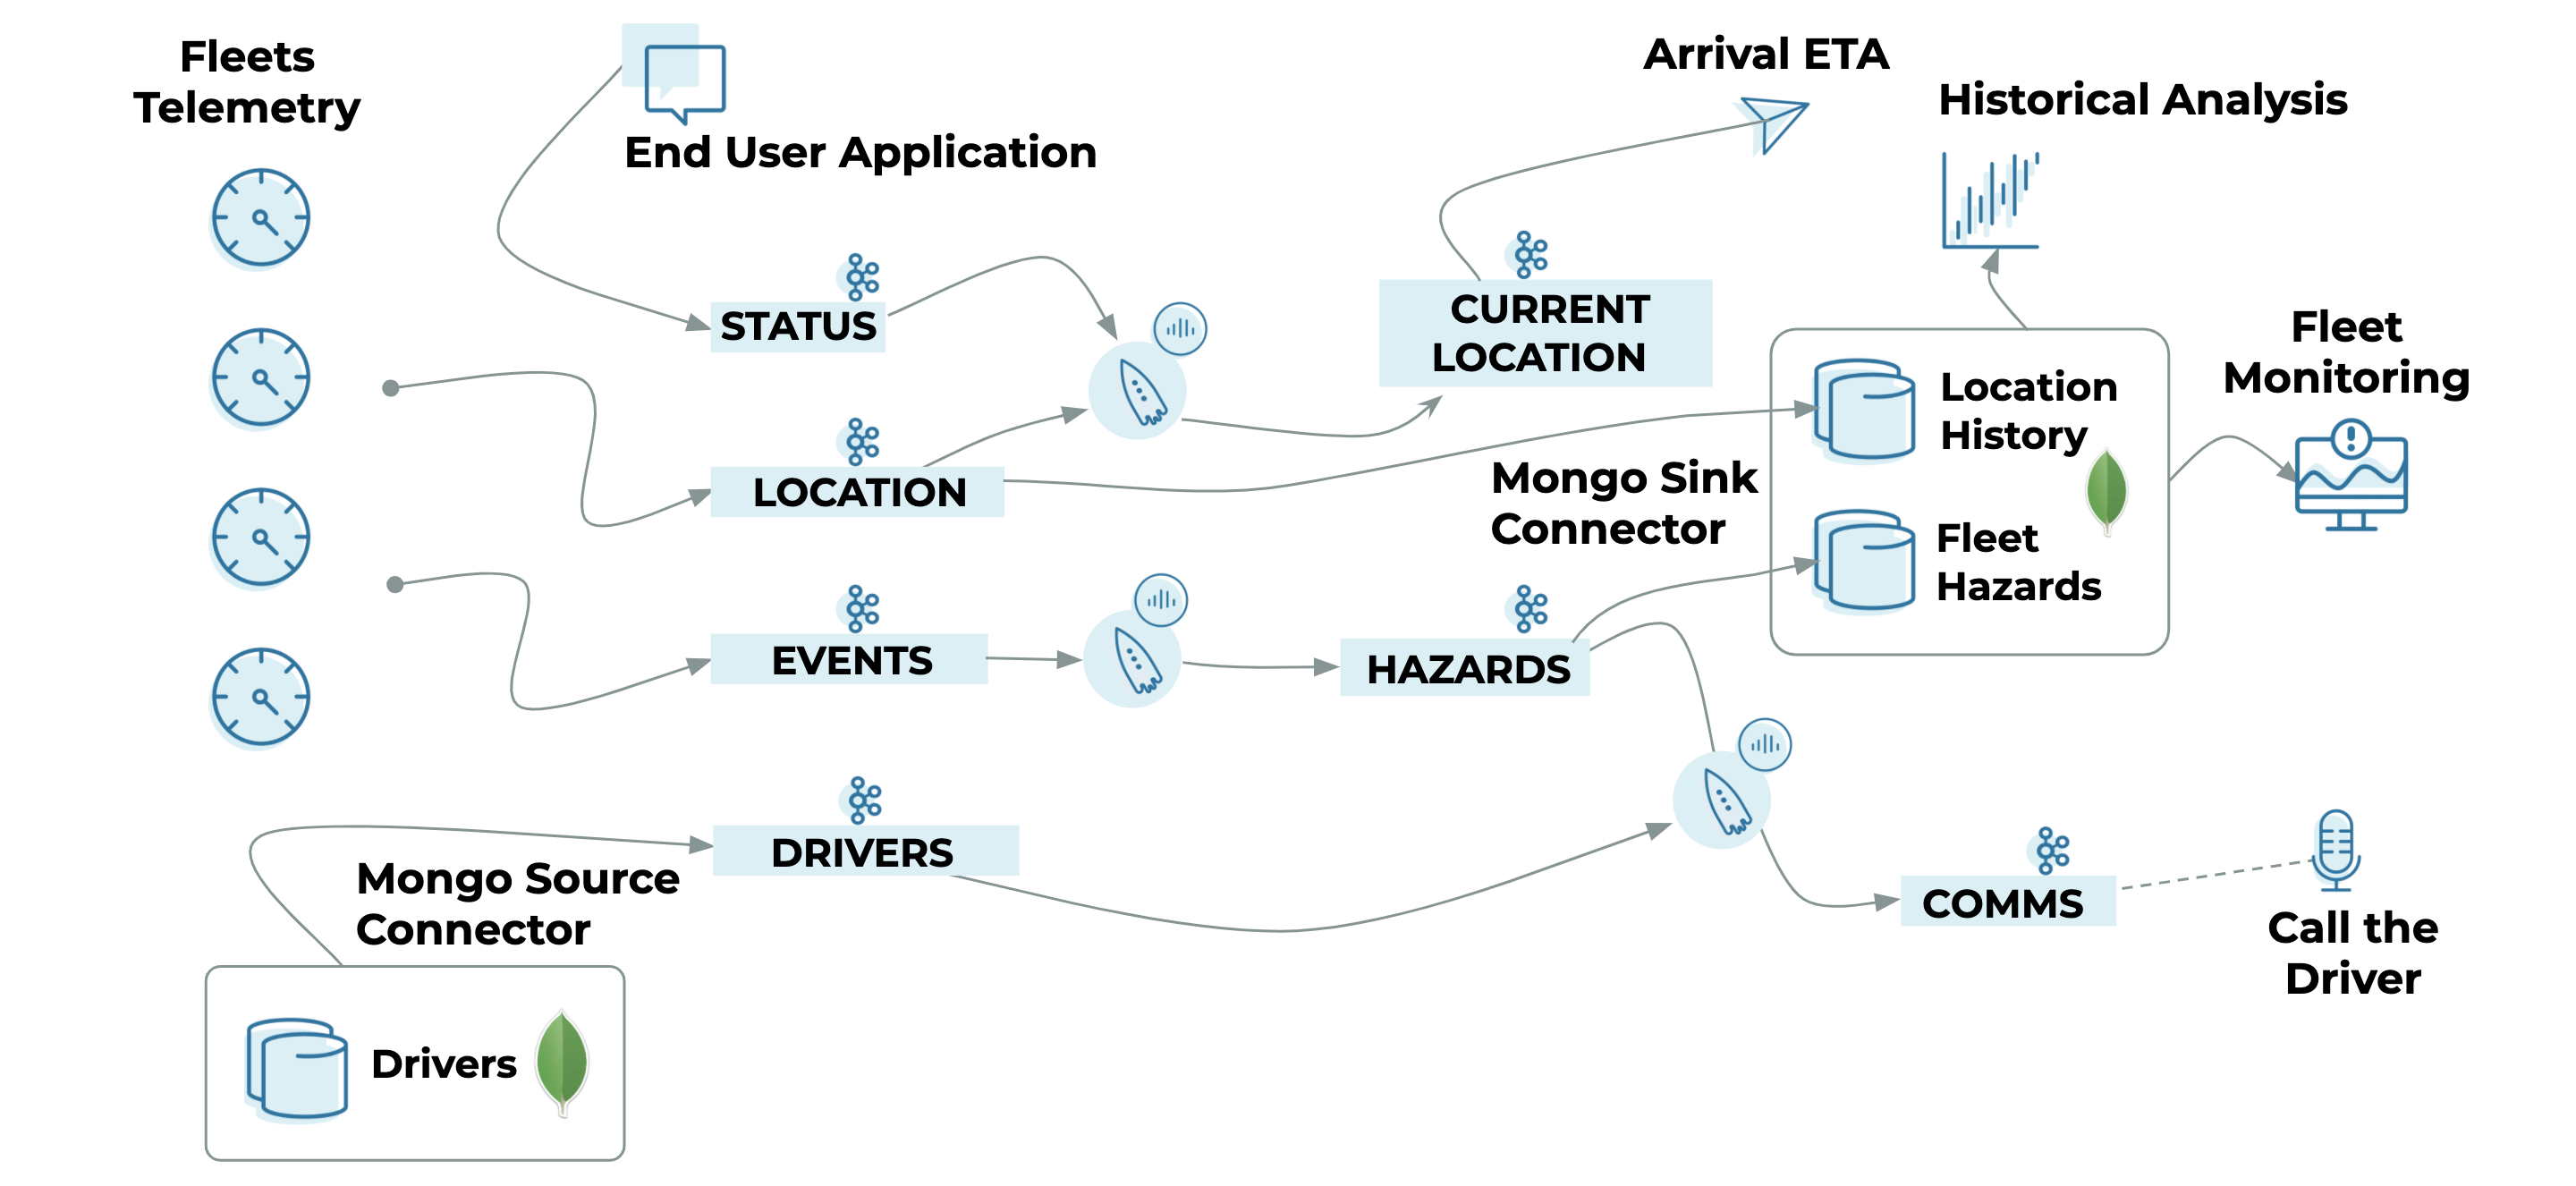
Confluent Cloud will be used to:
- Acquire telemetry data from a variety of fleets in real time
- Process and take action on real-time events (e.g., trigger a hazard event if a truck driver applies harsh braking more than three times within a five-minute window)
- Co-relate/join multiple events while fleets are on the move (e.g., determine delivery ETA by joining the fleets’ GPS data)
MongoDB is a modern, general-purpose database platform. It is uniquely designed to provide more flexibility and scalability for data storage and use. It is built around the JSON document model—a model that allows developers to work with data in a more natural, intuitive, and productive way. It uses a fundamentally different schema than legacy relational databases.
Because MongoDB schema are totally flexible and can vary from document to document, MongoDB is particularly well suited for fleet management. Take a look at this reference architecture for an in-depth view on how Confluent Platform and MongoDB complement each other.
MongoDB Atlas is MongoDB’s fully managed cloud service with operational and security best practices built in. In this exercise, MongoDB Atlas will be used to:
- Store events and location data for historical analysis
- Manage the end-to-end lifecycle of drivers and fleets (driver profiles, fleet specification, registration details, contact details, etc.)
- Serve user interfaces to capture changes, build monitoring dashboards, etc.
Prerequisites
- Sign up for a Confluent Cloud account, generate API keys and secrets for the Apache Kafka® broker and Confluent Schema Registry
- Spin up a database in MongoDB Atlas and grab the username and password
- Install docker-compose to bring up Kafka Connect
Data acquisition
In the real world, there are a variety of devices that generate telemetry data. Fleets come with standard sensors natively, such as GPS tracking, fuel, tyre pressure, weight, odometer, and brakes. Also, enterprises install custom sensors either to add more monitoring capabilities, or because the fleets don’t come with sensors installed natively. Furthermore, there are specialised devices to monitor driver fatigue, cabin air quality, autonomous assistance, etc.
In this exercise, we will use Voluble to mock telemetry data. Voluble is a Kafka connector that can generate mock data to one or more topics.
Source: Fleet telemetry
- Location topic: Capture a stream of location coordinates from the fleets’ GPS
{ "driverId": "76453", "timestamp": "Wed Apr 22 22:47:08 UTC 2020", "longitude": "-9.4150367", "fleetId": "22712764", "latitude": "71.725014" } - Events topic: Capture events from fleets using HARSH_BRAKING, OVER_SPEEDING, IDLING, IGNITION_ON, etc.
{
   "driverId": "76452",
   "timestamp": "Fri Apr 24 10:58:10 UTC 2020",
   "longitude": "88.269588",
   "fleetId": "25873937",
   "eventType": "HARSH_BRAKING",
   "latitude": "2.7032992"
}
Source: End user
- Status topic: Receive status check requests from end users to calculate delivery ETA
{
   "fleetId": "11799846",
   "timestamp": "Thu Apr 23 17:46:50 UTC 2020"
}
Source: MongoDB
- Mongo.Fleets.Drivers topic: Driver’s profile (including the changes) from the MongoDB fleets database
{
   "allowedVehicleType": "HDT",
   "Name": "Paul Klee",
   "drivingRating": "2",
   "driverId": "76453",
   "lastmodified": "Fri Apr 24 02:41:16 UTC 2020",
   "licenseNumber": "7854692092",
   "mobile": "597-686-5388"
}
Set up Kafka Connect
To keep it simple, use the following docker-compose.yml to bring up Kafka Connect and integrate it with Confluent Cloud.
Confluent Cloud now also allows you to preview the fully managed MongoDB Atlas Sink Connector and MongoDB Atlas Source Connector.
This process installs the following connectors within Kafka Connect:
---
version: '3'
services:

 kafka-connect-01:
   image: confluentinc/cp-kafka-connect:5.5.0
   container_name: kafka-connect-01
   ports:
     - 8083:8083
   environment:
     CONNECT_LOG4J_APPENDER_STDOUT_LAYOUT_CONVERSIONPATTERN: "[%d] %p %X{connector.context}%m (%c:%L)%n"
     CONNECT_CUB_KAFKA_TIMEOUT: 300
     ##
     CONNECT_BOOTSTRAP_SERVERS: "<<CLUSTER-BOOTSTRAP-HOST>>:9092"
     CONNECT_REST_ADVERTISED_HOST_NAME: 'kafka-connect-01'
     CONNECT_REST_PORT: 8083
     CONNECT_GROUP_ID: kafka-connect-group-01-v04
     CONNECT_CONFIG_STORAGE_TOPIC: _kafka-connect-group-01-v04-configs
     CONNECT_OFFSET_STORAGE_TOPIC: _kafka-connect-group-01-v04-offsets
     CONNECT_STATUS_STORAGE_TOPIC: _kafka-connect-group-01-v04-status
     CONNECT_KEY_CONVERTER: org.apache.kafka.connect.storage.StringConverter
     ##
     CONNECT_VALUE_CONVERTER_SCHEMAS_ENABLE: "false"
     ##
     CONNECT_KEY_CONVERTER_SCHEMA_REGISTRY_URL: "https://<<SR-HOST>>"
     CONNECT_KEY_CONVERTER_BASIC_AUTH_CREDENTIALS_SOURCE: "USER_INFO"
     ##
     CONNECT_KEY_CONVERTER_SCHEMA_REGISTRY_BASIC_AUTH_USER_INFO: "<<SR-API-KEY>>:<<SR-API-SECRET>>"
     CONNECT_VALUE_CONVERTER: org.apache.kafka.connect.json.JsonConverter
     CONNECT_VALUE_CONVERTER_SCHEMA_REGISTRY_URL: "https://<<SR-HOST>>"
     CONNECT_VALUE_CONVERTER_BASIC_AUTH_CREDENTIALS_SOURCE: "USER_INFO"
     CONNECT_VALUE_CONVERTER_SCHEMA_REGISTRY_BASIC_AUTH_USER_INFO: "<<SR-API-KEY>>:<<SR-API-SECRET>>"
     CONNECT_INTERNAL_KEY_CONVERTER: 'org.apache.kafka.connect.json.JsonConverter'
     CONNECT_INTERNAL_VALUE_CONVERTER: 'org.apache.kafka.connect.json.JsonConverter'
     CONNECT_LOG4J_ROOT_LOGLEVEL: 'INFO'
     CONNECT_LOG4J_LOGGERS: 'org.apache.kafka.connect.runtime.rest=WARN,org.reflections=ERROR'
     CONNECT_CONFIG_STORAGE_REPLICATION_FACTOR: '3'
     CONNECT_OFFSET_STORAGE_REPLICATION_FACTOR: '3'
     CONNECT_STATUS_STORAGE_REPLICATION_FACTOR: '3'
     CONNECT_PLUGIN_PATH: '/usr/share/java,/usr/share/confluent-hub-components/'
     # Confluent Cloud config
     CONNECT_REQUEST_TIMEOUT_MS: "20000"
     CONNECT_RETRY_BACKOFF_MS: "500"
     CONNECT_SSL_ENDPOINT_IDENTIFICATION_ALGORITHM: "https"
     CONNECT_SASL_MECHANISM: "PLAIN"
     CONNECT_SECURITY_PROTOCOL: "SASL_SSL"
     ##
     CONNECT_SASL_JAAS_CONFIG: "org.apache.kafka.common.security.plain.PlainLoginModule required username=\"<<CLUSTER-API-KEY>>\" password=\"<<CLUSTER-API-SECRET>>\";"
     #
     CONNECT_CONSUMER_SECURITY_PROTOCOL: "SASL_SSL"
     CONNECT_CONSUMER_SSL_ENDPOINT_IDENTIFICATION_ALGORITHM: "https"
     CONNECT_CONSUMER_SASL_MECHANISM: "PLAIN"
     ##
     CONNECT_CONSUMER_SASL_JAAS_CONFIG: "org.apache.kafka.common.security.plain.PlainLoginModule required username=\"<<CLUSTER-API-KEY>>\" password=\"<<CLUSTER-API-SECRET>>\";"
     CONNECT_CONSUMER_REQUEST_TIMEOUT_MS: "20000"
     CONNECT_CONSUMER_RETRY_BACKOFF_MS: "500"
     #
     CONNECT_PRODUCER_SECURITY_PROTOCOL: "SASL_SSL"
     CONNECT_PRODUCER_SSL_ENDPOINT_IDENTIFICATION_ALGORITHM: "https"
     CONNECT_PRODUCER_SASL_MECHANISM: "PLAIN"
     ##
     CONNECT_PRODUCER_SASL_JAAS_CONFIG: "org.apache.kafka.common.security.plain.PlainLoginModule required username=\"<<CLUSTER-API-KEY>>\" password=\"<<CLUSTER-API-SECRET>>\";"
     CONNECT_PRODUCER_REQUEST_TIMEOUT_MS: "20000"
     CONNECT_PRODUCER_RETRY_BACKOFF_MS: "500"
     # External secrets config
     # See https://docs.confluent.io/current/connect/security.html#externalizing-secrets
     CONNECT_CONFIG_PROVIDERS: 'file'
     CONNECT_CONFIG_PROVIDERS_FILE_CLASS: 'org.apache.kafka.common.config.provider.FileConfigProvider'
   command:
     - bash
     - -c
     - |
       echo "Installing connector plugins"
       confluent-hub install --no-prompt mdrogalis/voluble:0.3.0
       confluent-hub install --no-prompt mongodb/kafka-connect-mongodb:1.1.0
       #
       echo "Launching Kafka Connect worker"
       /etc/confluent/docker/run &
       #
       sleep infinity
Start Kafka Connect
Execute this command in directory where you have placed docker-compose.yml:
docker-compose up
Configure the connectors
Voluble
Use the following Connect config to install the Voluble producer, which is configured to produce data for location, events, and status topics. In the example below, we simulate active data from a fleet.
More details on Voluble configurations can be found on the Confluent Hub.
{
   "name": "voluble-telemetry-producer",
   "config": {
       "connector.class": "io.mdrogalis.voluble.VolubleSourceConnector",
       "genkp.location.with": "#{Internet.uuid}",
       "genv.location.latitude.with": "#{Address.latitude}",
       "genv.location.longitude.with": "#{Address.longitude}",
       "genv.location.timestamp.with": "#{date.between 'Sun Apr 22 01:59:02 PDT 2020','Sun Apr 25 01:59:02 PDT 2020'}",
       "genv.location.fleetId.with": "#{number.number_between '3763527','37635532'}",
       "genv.location.driverId.with": "#{number.number_between '76452','76454'}",
       "genkp.status.with": "#{Internet.uuid}",
       "genv.status.timestamp.with": "#{date.between 'Sun Apr 22 01:59:02 PDT 2020','Sun Apr 25 01:59:02 PDT 2020'}",
       "genv.status.fleetId.matching": "location.value.fleetId",
       "topic.status.throttle.ms": "5000",
       "genkp.events.with": "#{Internet.uuid}",
       "genv.events.eventType.with": "HARSH_BRAKING",
       "genv.events.latitude.with": "#{Address.latitude}",
       "genv.events.longitude.with": "#{Address.longitude}",
       "genv.events.timestamp.with": "#{date.between 'Sun Apr 24 01:59:02 PDT 2020','Sun Apr 26 01:59:02 PDT 2020'}",
       "genv.events.fleetId.matching": "location.value.fleetId",
       "genv.events.driverId.matching": "location.value.driverId",
       "global.throttle.ms": "200",
       "global.history.records.max": "1000"
   }
}
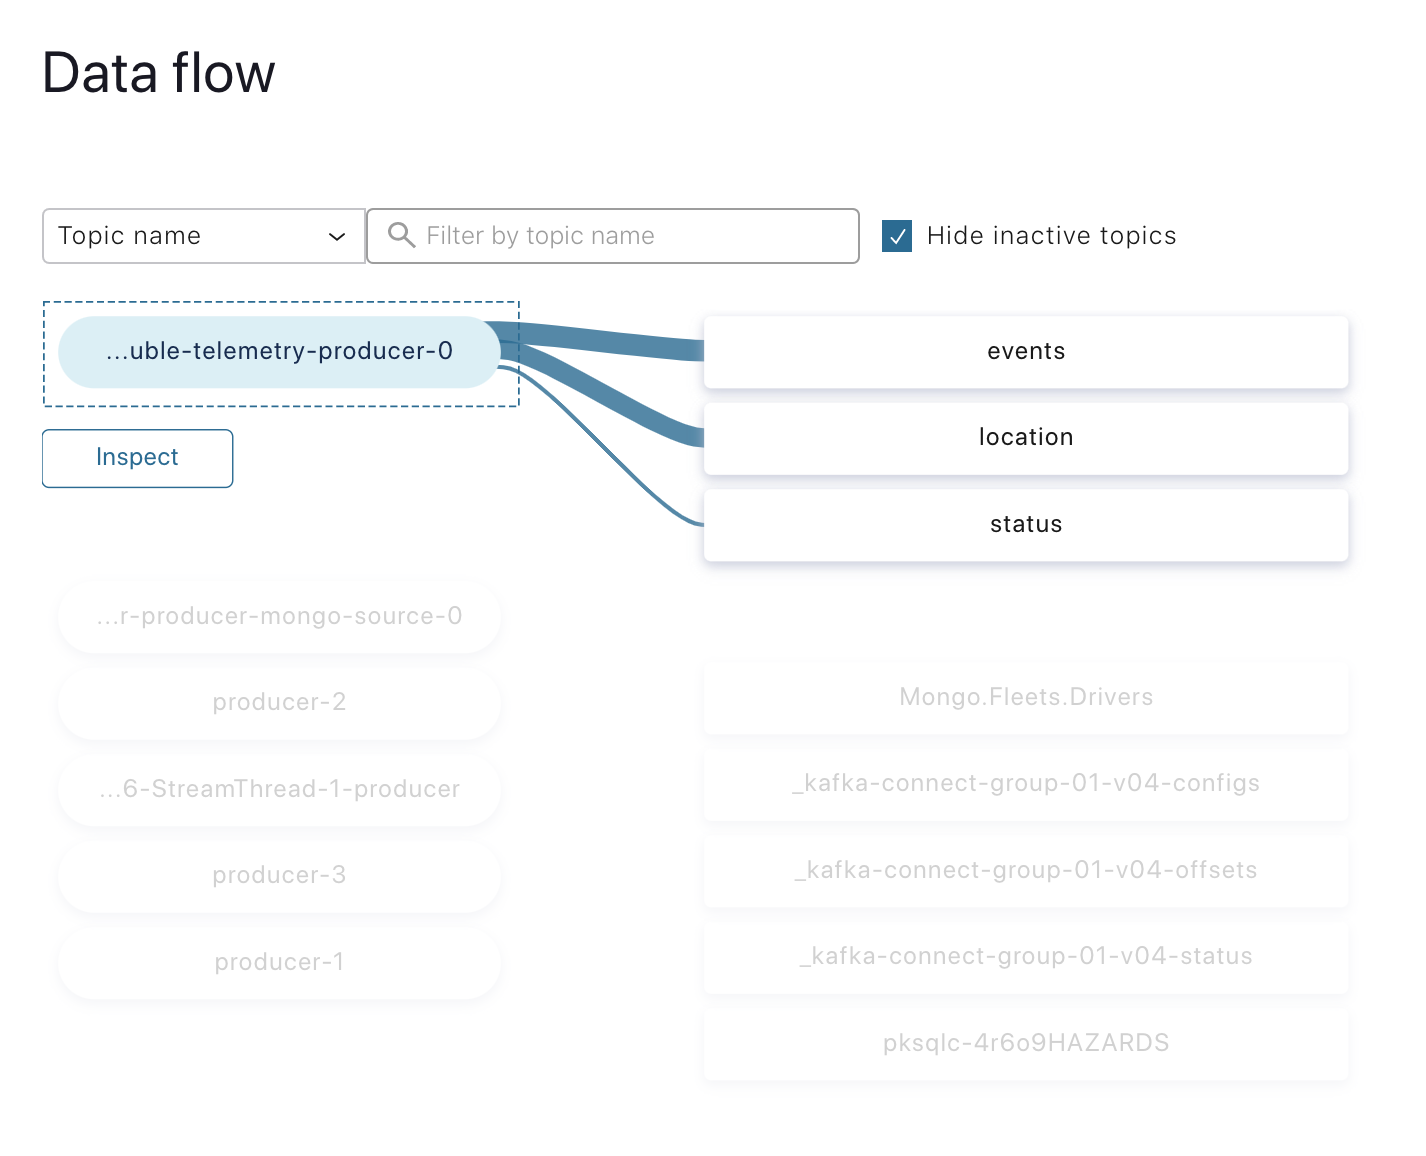
Once the Voluble connector is up, the “Data flow” view can be used to visualise the lineage between the Voluble producer and the receiving topics:
MongoDB source (driver data)
Use the following configuration to spin up a source connector that exports the Drivers collection from the fleets database to a Kafka topic.
The MongoDB source connector is one of the best possible ways to capture changes from the Drivers collection.
The MongoDB connector allows you to configure topic.prefix only, which is followed by the database and collection name automatically. (Make sure to create a Mongo.Fleets.Drivers topic in Confluent Cloud before activating this connector. Auto topic creation is disabled in Confluent Cloud.)
{
   "name": "mongo-source",
   "config": {
       "tasks.max": 1,
       "connector.class": "com.mongodb.kafka.connect.MongoSourceConnector",
       "key.converter": "org.apache.kafka.connect.storage.StringConverter",
       "value.converter": "org.apache.kafka.connect.storage.StringConverter",
       "connection.uri": "mongodb+srv://user:password@fleet***mongodb.net/Fleets",
       "topic.prefix": "Mongo",
       "copy.existing": "true",
       "database": "Fleets",
       "collection": "Drivers"
   }
}
Now the Mongo.Fleets.Drivers topic will automatically capture changes from the Drivers collection.
MongoDB sink
Use the following configuration to spin up sink connectors that export hazard events and location data to MongoDB for historical analysis.
- Hazard events: Exports hazardous events from the Hazard topic to the FleetHazards MongoDB collection.
{ "name": "mongo-sink-hazards", "config": { "connector.class": "com.mongodb.kafka.connect.MongoSinkConnector", "tasks.max": "1", "topics": "pksqlc-4r6o9HAZARDS", "connection.uri": "mongodb+srv://user:password@fleet*****mongodb.net/Fleets", "database": "Fleets", "collection": "FleetHazards", "key.converter": "org.apache.kafka.connect.storage.StringConverter", "value.converter": "org.apache.kafka.connect.storage.StringConverter", "value.converter.schemas.enable": "false", "key.converter.schemas.enable": "false", "document.id.strategy": "com.mongodb.kafka.connect.sink.processor.id.strategy.BsonOidStrategy", } } - Location stream: Export the stream of GPS coordinates from the location topic to the LocationHistory MongoDB collection
   {
       "name": "mongo-sink-location",
       "config": {
           "connector.class": "com.mongodb.kafka.connect.MongoSinkConnector",
           "tasks.max": "1",
           "topics": "location",
           "connection.uri": "mongodb+srv://user:password@fleet*****mongodb.net/Fleets",
           "database": "Fleets",
           "collection": "LocationHistory",
           "key.converter": "org.apache.kafka.connect.storage.StringConverter",
           "value.converter": "org.apache.kafka.connect.storage.StringConverter",
           "value.converter.schemas.enable": "false",
           "key.converter.schemas.enable": "false",
           "document.id.strategy": "com.mongodb.kafka.connect.sink.processor.id.strategy.BsonOidStrategy"
       }
   }
Note: You can directly post these configs to Kafka Connect REST admin endpoint to spin up the respective connectors (either using curl or Postman). For more details, see the documentation.
All the deployed connectors can be viewed using http://localhost:8083/connectors.
Stream processing
The mock data is ready, and we have the connectors to integrate with MongoDB. Now let’s build the end-to-end flow using stream processing. We will use continuous ksqlDB queries to process the events.
Stream processing complements a variety of use cases in fleet management, which includes fleet scheduling, route optimisation, visual tracking with maps, order management, real-time alerting, and more.
This blog post will build two simple use cases: driver safety and fleet location.
Use case A: Driver safety with hazard alerts
Today’s fleets have way too many sensors, and as a result, there can be hundreds of events triggered from each vehicle every second. There are sensors that come installed by the original manufacturers as well as sensors installed by the owners, depending on the use case.
Voluble connector will randomly produce HARSH_BRAKING events to Kafka topics, as shown in the example below:
{
   "driverId": "76452",
   "timestamp": "Fri Apr 24 10:58:10 UTC 2020",
   "longitude": "88.269588",
   "fleetId": "25873937",
   "eventType": "HARSH_BRAKING",
   "latitude": "2.7032992"
}
Now we’ll build a ksqlDB application to process these events in real time. We’ll start with a simple hazard rule to detect drivers who are demonstrating hazardous driving. if a driver applies a harsh brake more than three times within a five-minute window, it should trigger an event to the hazard topic with driverId.
The driverId is used to join the lookup data sourced from MongoDB, and the driver’s details can be used to trigger an automated call to the driver’s phone number using Twilio, for example.
First, create a fleet event stream on top of the Event topic:
CREATE STREAM FLEET_EVENT_STREAM (
 eventType varchar, speedCaptured integer,
 latitude double, longitude double,
 timestamp varchar, driverId varchar,
 fleetId varchar
) WITH (
 kafka_topic = 'events', value_format = 'JSON',
 timestamp = 'timestamp', timestamp_format = 'E MMM dd HH:mm:ss z yyyy'
);
When it comes to building stream processing applications, it is critical to use stream and table semantics. This article does an excellent job of explaining them in detail.
Next, create a ksqlDB app to capture hazardous events:
CREATE TABLE HAZARDS AS
SELECT driverId,
 COUNT(*)
FROM FLEET_EVENT_STREAM
WINDOW TUMBLING (SIZE 300 SECONDS)
WHERE eventType='HARSH_BRAKING'
GROUP BY driverId
HAVING COUNT(*) > 3;
The above step will now create a continuous ksqlDB query, which will trigger hazardous events to the HAZARDS table.
Underneath a stream or a table, there will always be a topic, which can be subscribed to by other connectors/microservices to trigger any relevant workflows. It could trigger an alert to the operations team, who can call the driver to check to see if he is doing okay. Or it can also trigger an automated voice call to the driver directly using a service like Twilio. The possibilities are endless.
Use case B: Checking the current location of a fleet
There are many scenarios where the customer/operator would want to check on the location of a vehicle to calculate the ETA.
Create a STATUS_REQUEST stream where status check events will be published with FleetId:
CREATE STREAM STATUS_REQUEST (timestamp varchar, fleetId varchar) WITH (kafka_topic='status', value_format='JSON', timestamp='timestamp', timestamp_format='E MMM dd HH:mm:ss z yyyy');
Create LOCATION_STREAM based on location topic, where a stream of GPS coordinates will be published:
CREATE STREAM LOCATION_STREAM (latitude double, longitude double, timestamp varchar, fleetId varchar) WITH (kafka_topic='location', value_format='JSON', timestamp='timestamp', timestamp_format='E MMM dd HH:mm:ss z yyyy');
Join the streams to match FleetId with its relevant GPS coordinates:
CREATE STREAM STATUS_NOTIFICATIONS AS
SELECT s.fleetId, l.latitude, l.longitude
FROM STATUS_REQUEST s
INNER JOIN LOCATION_STREAM l
WITHIN 1 DAYS
ON s.fleetId = l.fleetId
EMIT CHANGES;
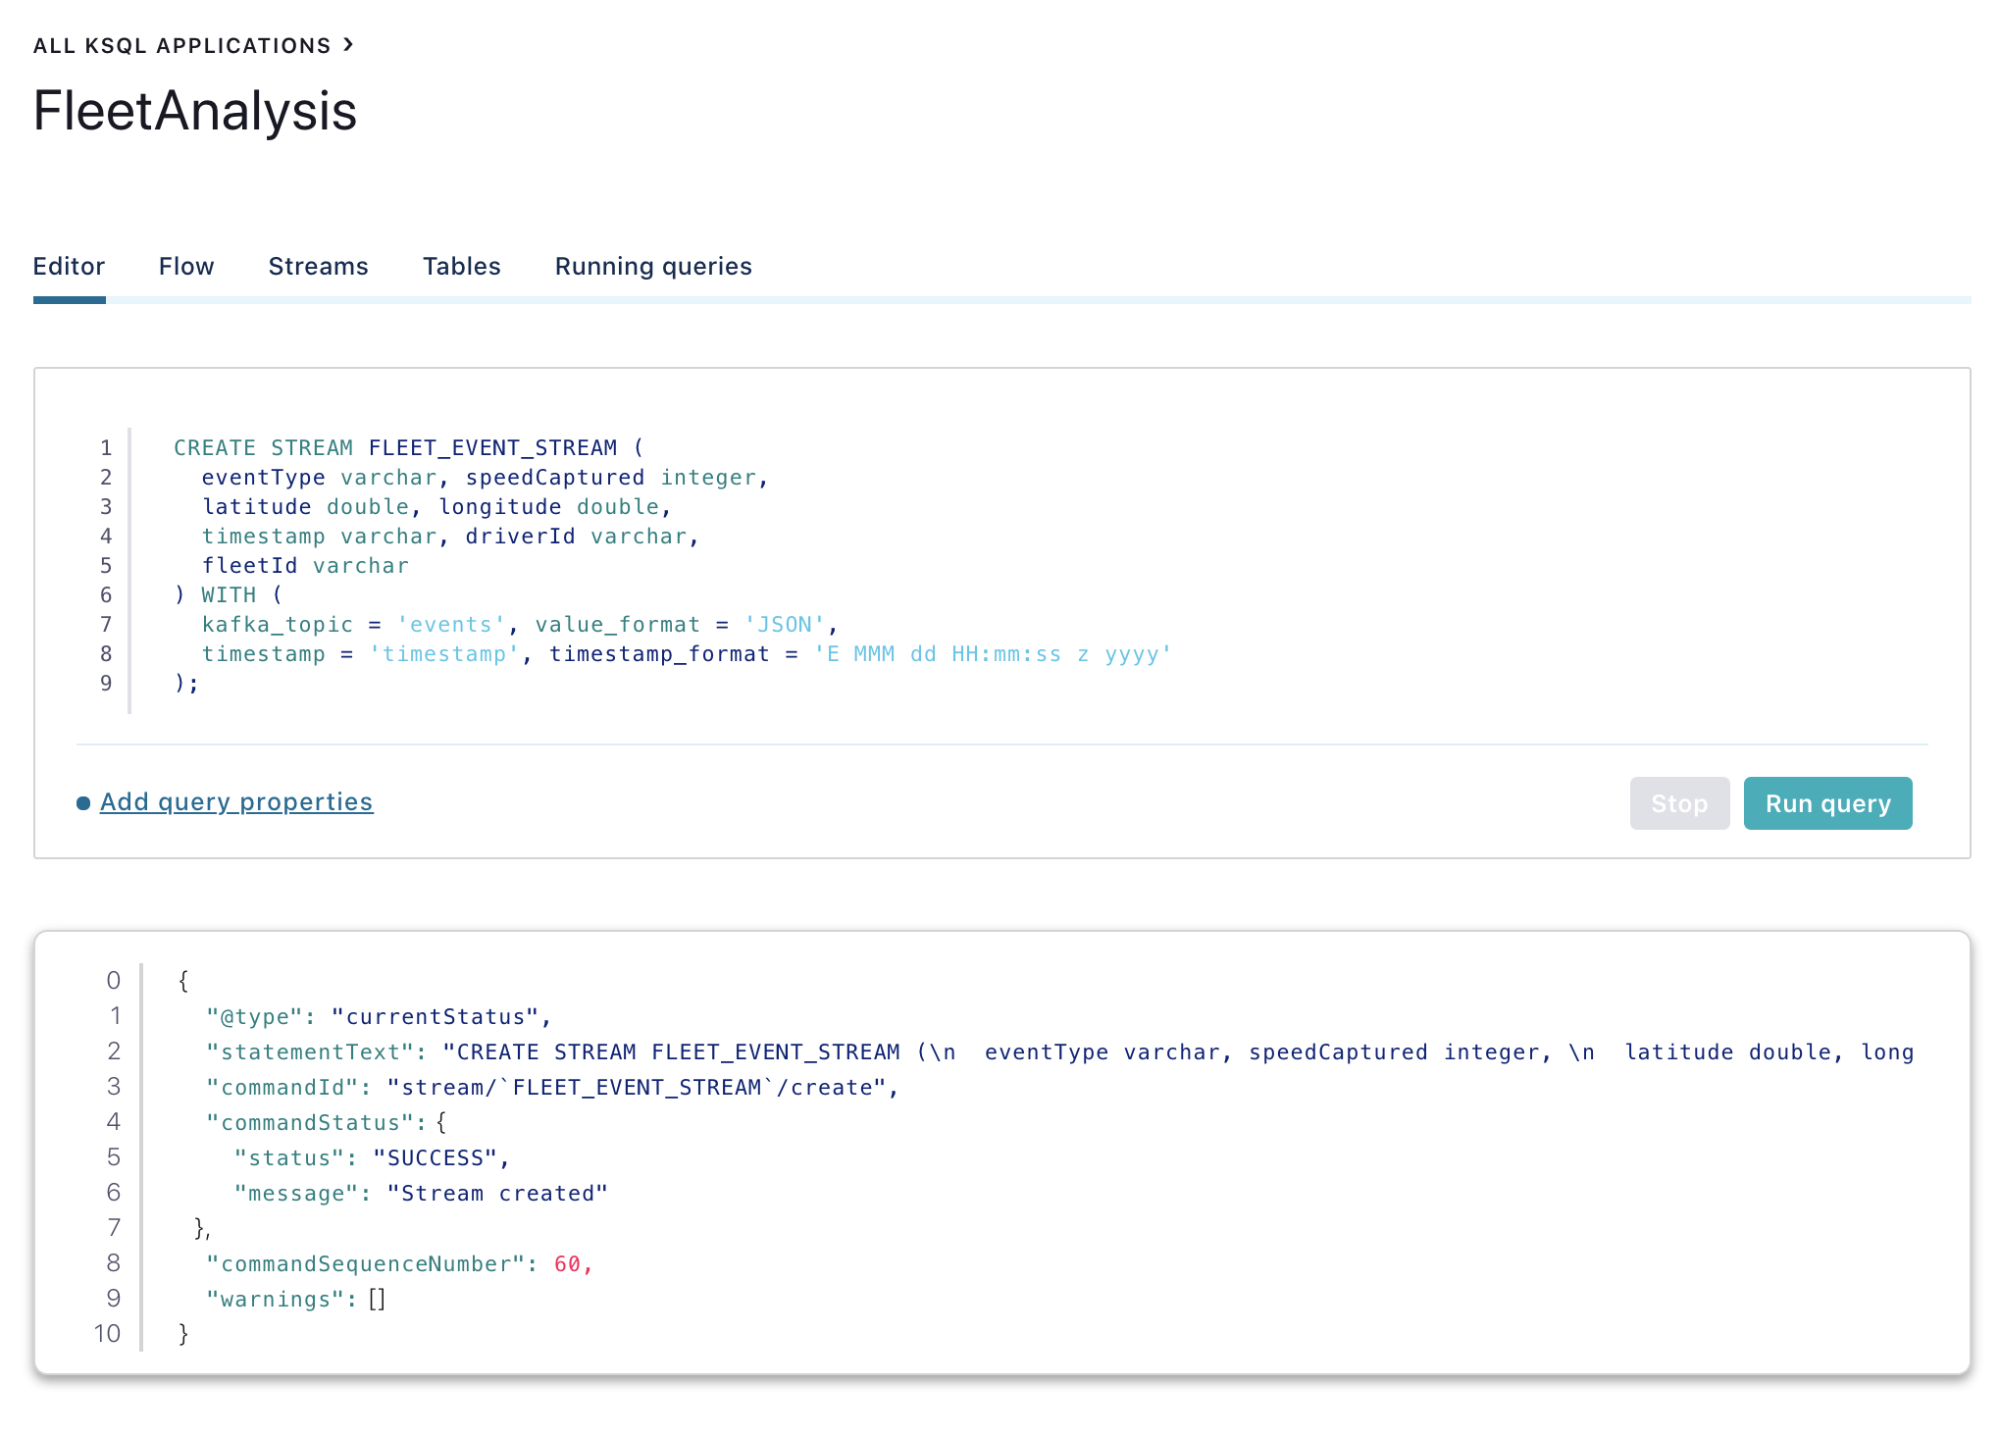
In the Confluent Cloud web console, the ksqlDB editor can be used to run these queries:
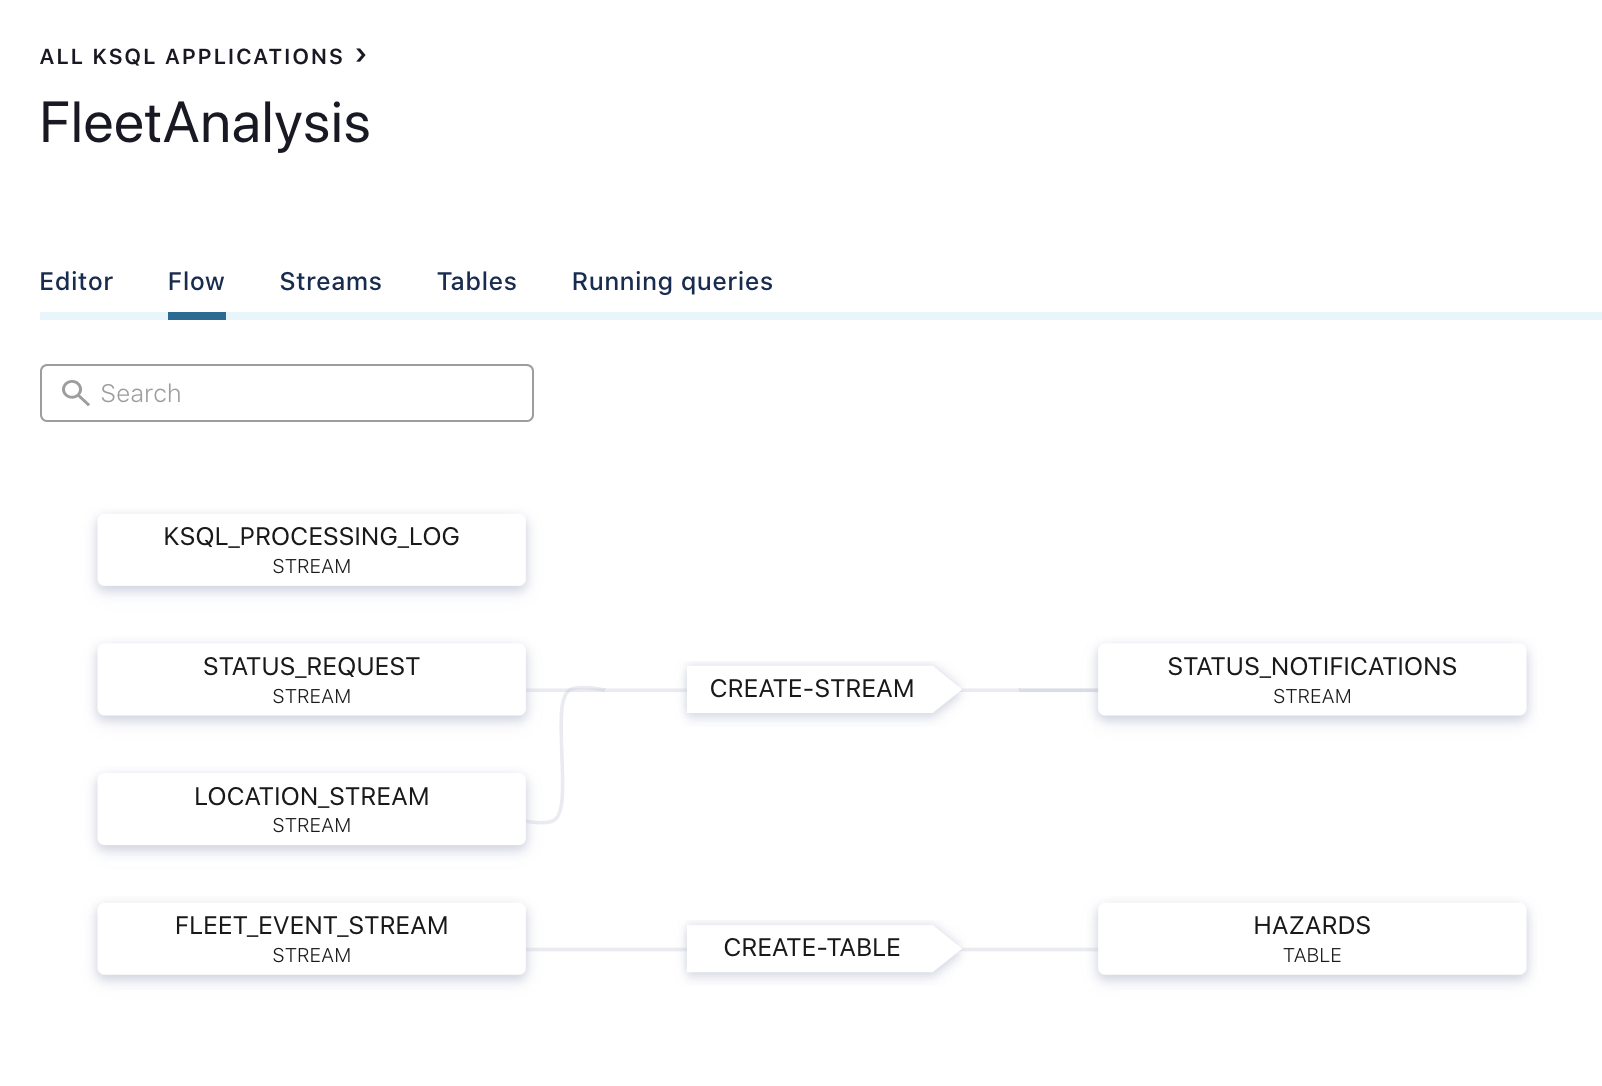
Also, the ksqlDB “Flow” tab automatically builds the dataflow by linking the topics and continuous queries involved.
Storing data in MongoDB using the sink connector
We are able to produce hazardous events data based on driving patterns. We are also able to capture real-time telemetry data like location and harsh-braking events from the fleets.
We have already configured the MongoDB sink connector to export events from the location and hazard topics to MongoDB, so all events should have exported to the MongoDB collections as shown below:
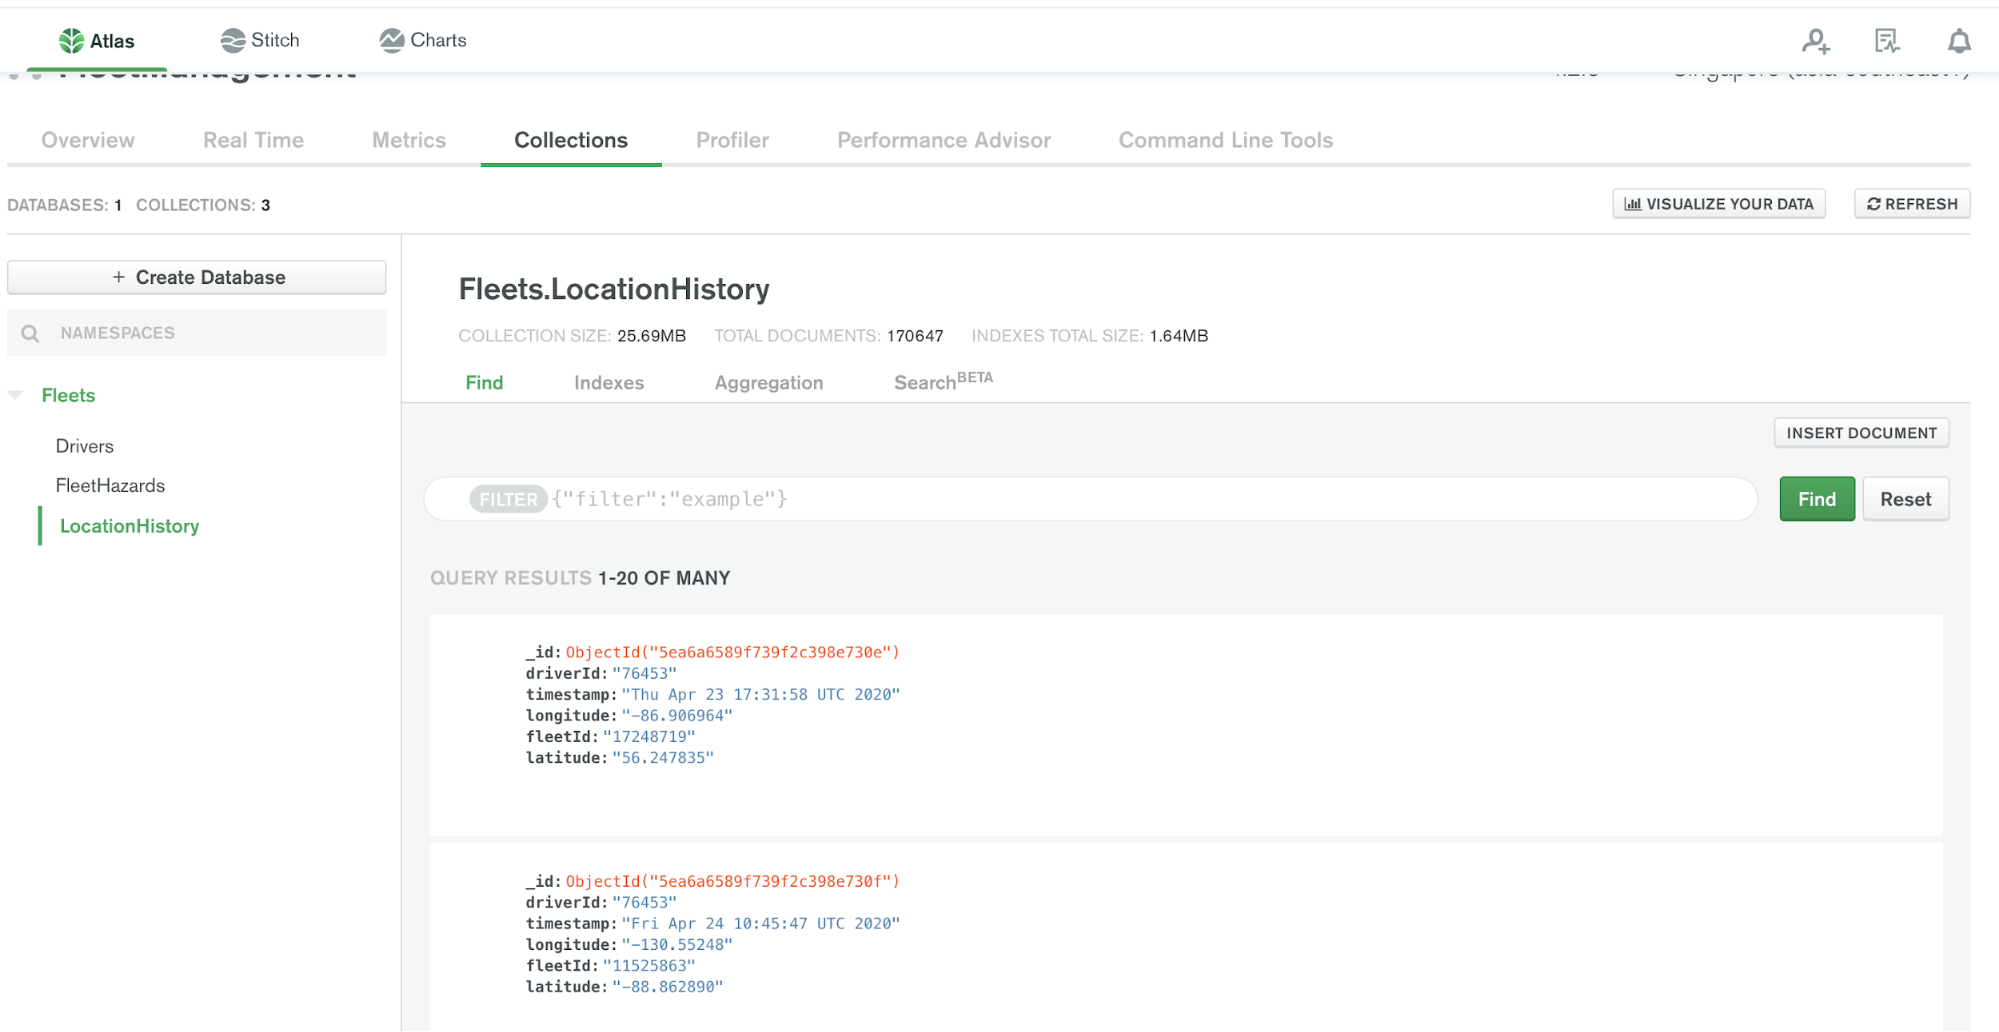
The data stored in MongoDB can be used for building dashboards, historical data analysis, training machine learning models, and more. Also, the other MongoDB collections (e.g., Drivers) will be integrated with the UI layer to capture changes on the Drivers contact and other profile updates.
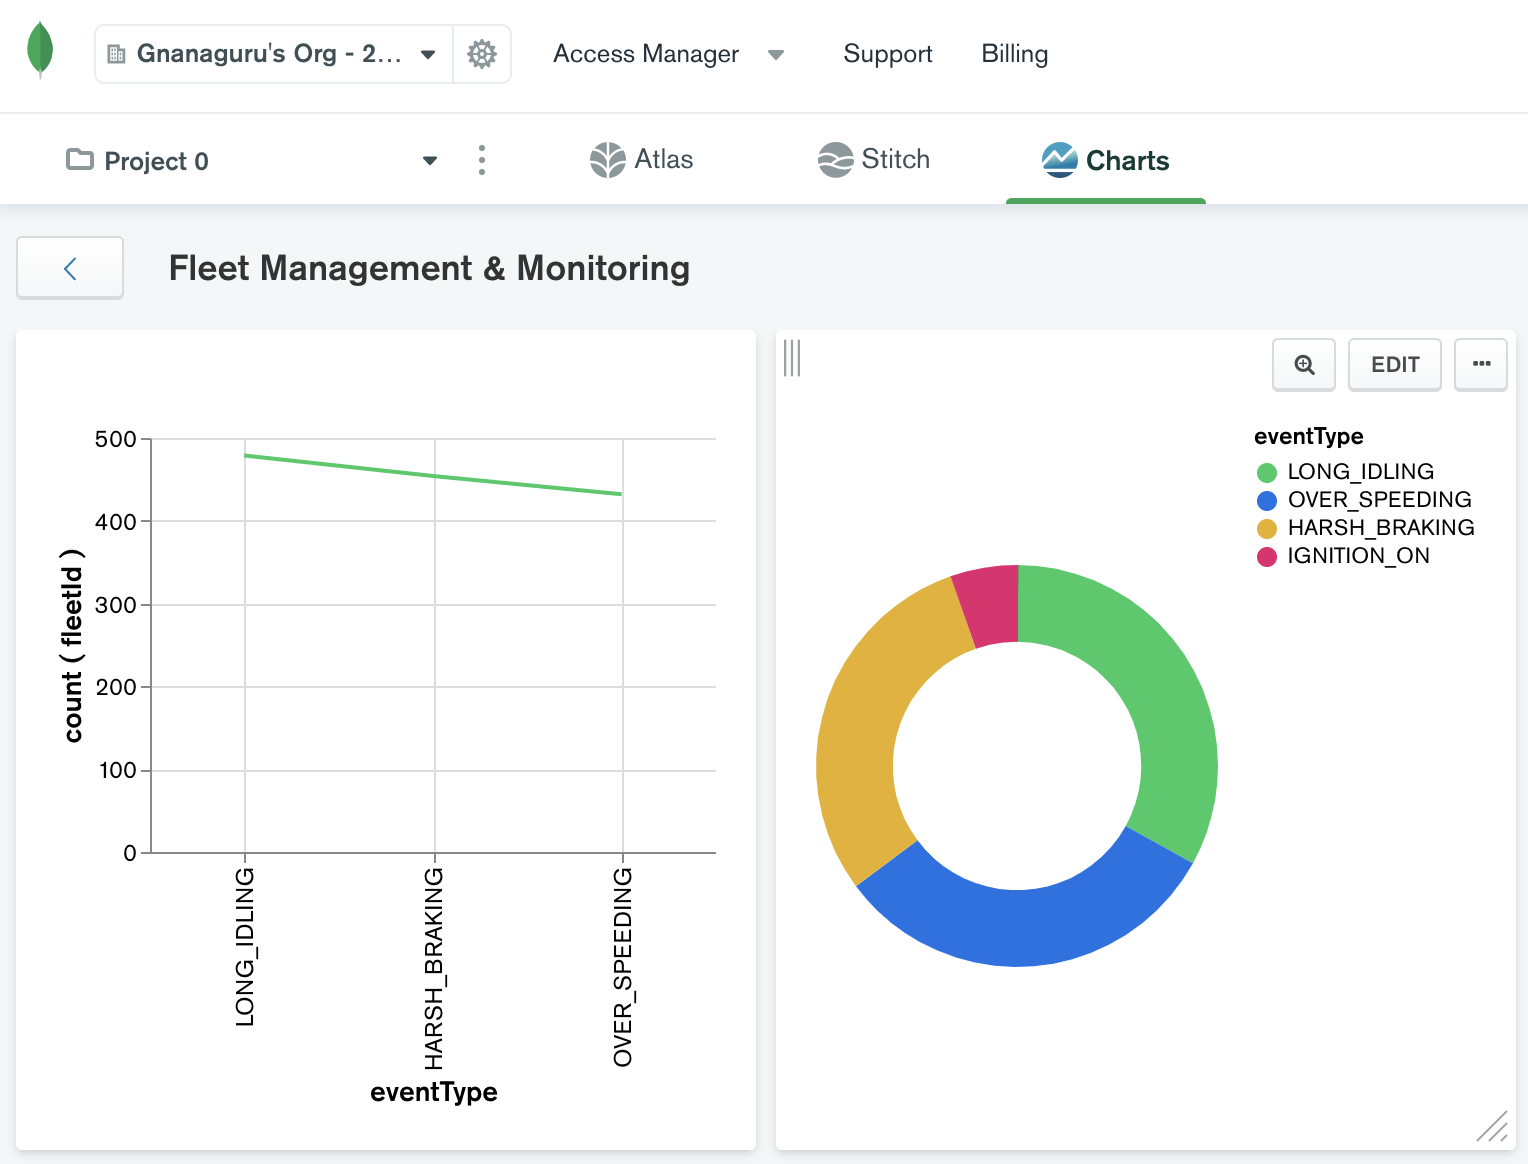
In addition, MongoDB Charts can be used to create embeddable charts and dashboards using the data stored in Atlas.
Summary
Confluent Cloud and MongoDB as a combination work well in the design of an overall fleet management solution. The growing rise of autonomous fleets, advanced delivery systems, and the potential for drone delivery services demand sophisticated fleet management solutions in enterprises. Confluent Cloud and MongoDB can help enterprises rapidly build solutions that simplify end-to-end fleet operations and improve overall customer experience and efficiency.
To learn more, check out this joint session between Confluent and MongoDB from MongoDB.live.
If you haven’t already, you can learn more by checking out Confluent Cloud, a fully managed event streaming service based on Apache Kafka, and use the promo code CL60BLOG to get an additional $60 of free Confluent Cloud usage.*
Ist dieser Blog-Beitrag interessant? Jetzt teilen
Confluent-Blog abonnieren
How to Implement Your First ML Function in Streaming
Learn how to add your first ML model to a real-time streaming pipeline. Learn a simple, low-risk pattern for inference, scoring, and deployment with Apache Kafka®.
Sustainable Streaming Architectures: A GreenOps Guide to Efficient, Low-Carbon Data Systems
Design energy-efficient, low-cost streaming systems. Learn GreenOps patterns to reduce compute waste, optimize storage, and lower the carbon footprint of real-time data.

